ICXBTC trade ideas

ICX (ICON) going for last wave - update (2)At this time we see a corrective wave with ICXBTC (ABC). With a textbook pattern for wave 2. It seems that there is a third wave starting now. It's projection would give us point C. However in a bullish market we could see a flat pattern. Both points are also supports, which makes this forecast plausible. Let's see how this will work out.

ICON Cup and Handle Pattern Spotted!Cup and handle patterns spotted on the 1h timeframe indicating that bullish action is likely. After breakthrough there is very little resistance and massive room for growth, you can see this on the ICON/USD chart as well.
However, don't forget to do your own research before trading ;).


ICX (ICON) going for last wave It seems like ICS is showing us a nice elliot wave. We see a nice retracement during the second wave and followed by a third wave with a factor of 1.6 of the first wave. The fourth wave seems to come to an end. If the last wave is comparable to first wave we get a nice prediction. Let's see how this develops the coming hours.

$ICX, Trying to break from tiny accumulation over ~3250 sats$ICX
Trying to break from tiny accumulation over ~3250 sats support
Very similar to prior interations, volume never shined
UCTS Starting to signal buys on LTFs (12H or lower)
Continuation from here could lead toward a new test of the 4k sats level (~10% from current value)
#ICX

ICXBTC should catapult higher!All stars seem aligned for this pair to trade higher. It has broken resistance at 0.00004060 and also the neckline at 0.00004340/45 approximately. That means we have a huge upside potential for this pair in the days to come. The DMI+ has cross above too and that insinuates that the break out has more legs to go! The Head and Shoulder formation's ultimate target is approximately 0.0001010. I did not manage to buy on that break. I am long on retracement around the 0.00004520. So lets go!
Disclaimer: Invest at your own risk!

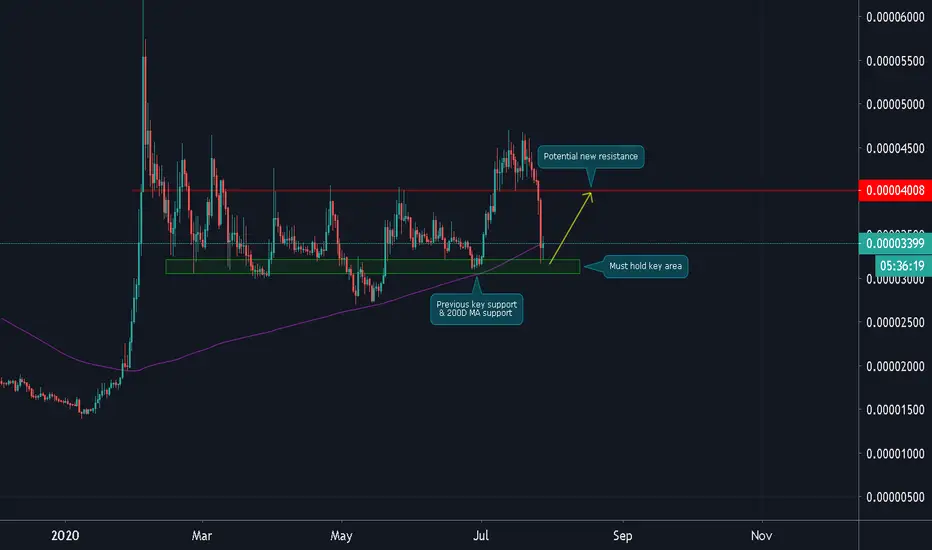
ICX/BTC (Strong Recovery?)ICX/BTC
-ICON just had a 50% recovery from the low at 3160 area
-The price is now back at previous high
-Currently testing resistance
-If there will be strong recovery/uptrend continuation
-The green support area or 4400 range must hold
-Next key resistance is 6495 sat
-I do not recommend to buy at current market price
-Let's wait if ICON can hold important level next week

Nice opportunity for ICX this month !!After correction from 0.78 fibo to 0.38, ICX is now retracing, if we breakout the triangle from above (red downtrend and 0.78 fibo level), we will see new highs soon ...
That's what we are expecting now for ICXBTC in upcoming days due to amazing upcoming news for this pair by the end of the month ...
Breaking out 0.78 level (4707 sat) will lead us to next levels, and as we are now on the bottom of a new uptrend channel, we can easily see ICXBTC :
Target 1: 5601
Target 2: 6738
Target 3: 7198
Target 4: 8184


ICX look sexy by forming ANTI ALTERNATE SHARK Harmonic Pattern ICX look sexy by forming ANTI ALTERNATE SHARK Harmonic Pattern
Entry 3400-3350
Sell Zone 4050-4600 - hold
Stop-lose: 1D Close below 3160 and Rentry @ 2800


#ICXBTC (Mid Term) 8/20 #ICXBTC (Mid Term)
Buy : 0.00003552 - 0.00003374 - 0.00003206
Target 1: 0.00003730
Target 2: 0.00004085
Target 3: 0.00004795
Target 4: 0.00008038
Stoploss: 0.00003141
Signal R/R: 7% / 70%
Net ROI : 30.5%
Invest: 3%
Duration: 7-30 days
Confidence in Trade : Medium
we ask Allah reconcile and repay.

$ICX : Korean Etherum with great FAICX in a new accumulation range after a first move.
Check supports & resistances
In USD drawing an asending triangle with 0.42 - 0.44 USD before high move
ICX got great fundamentals (Using information from Markus - ICX Team)
- The only Korean blockchain company to receive the Ministry of Science & ICT
- ICON’s breakthrough LFT 2 algorithm was praised by an audit from a top Korean research university
- ICONLOOP’s MyID (DID Blockchain solution) is the only DID solution that’s been approved by Korea’s FSC (SEC equivalent) and currently in use by 70+ entities including Korea’s 4 largest banks and the likes of Samsung Electronics- MyID is one of the strongest potential contenders to replace Korea’s Accredited Certification.

Months of consolidation come down to his moment.Daily completed an Inverse H&S since January highs. Did what looks to be a final shakeout which touched support around 3100 sats followed by a 4hr H&S with another shakeout at 3200 sats. DAily RSI Divergence up and in over sold region. I say up up and away. DYOR. THis is crypto.


ICX / BTC Daily (Short Edit)ICX,
Big hidden bullish divergence on daily, Potential big cup forming also MYID will come out this months! Expact to break Weekly order block and if hold I Expect it could go crazy!
Keep an eye on ICX these weeks mates!


ICX/BTC (Testing Key Support @ 200D MA)ICX/BTC
-After a fail breakout, the price is back to the 200D MA support
-The 200ma is confluence of previous Higher Low at 3100 range
-Can we expect a good bounce from this area?
-Well, if only BTC will move sideways and Dominance chart for the next 5 days
-Then, it is likely to see ICX bounce up to 4000 sat area
-Bearish scenario, close below the green area will send the price down to 2700 region
ICXBTC Inverse Head and Shoulders Breaking - Target 5000 satsLooks like an Inverse head and shoulders breaking on the daily.
Target 1 - 5000 sats

ICX/BTC to mave a move upwards!?After what looks to be an accumulation period which went from Feb 10th to June 29th price has recently broke through the Weekly Resistance of 4139sats and is now back testing as Support. If price holds this Support there should be nothing stopping it from having another attempt at the Monthly Resistance of 5500sats. However, if price were to lose this Support then it would have formed another Lower High which would be a bearish sign....

ICX.BTC (Y20.P3.E1).Upward pressure building upHi All
Just below the current strong resistance we have a ascending triangle.
Can it break through this without another pullback is the question and risk.
12 HRLY chart, close up
3Day chart, 13 hrs to go, bullish candle so far
MACRO overview
My thoughts:
Based on the RSI, I feel its going to spring up as its above 50% on the bounce, the bullish area and you can see the RSI reflecting the squeeze.
Tell you the truth, I don't know if it requires 1 more bounce in this small range.
With the 2 touches to the top and 2 touches to the bottom complete the ABCD formation with E in the middle.
I think it has a good chance breaking to the upside.
How to trade this?
I want to see how the 12 HRLY candle closes (1 hr left)
Cheers,
S.Sari
