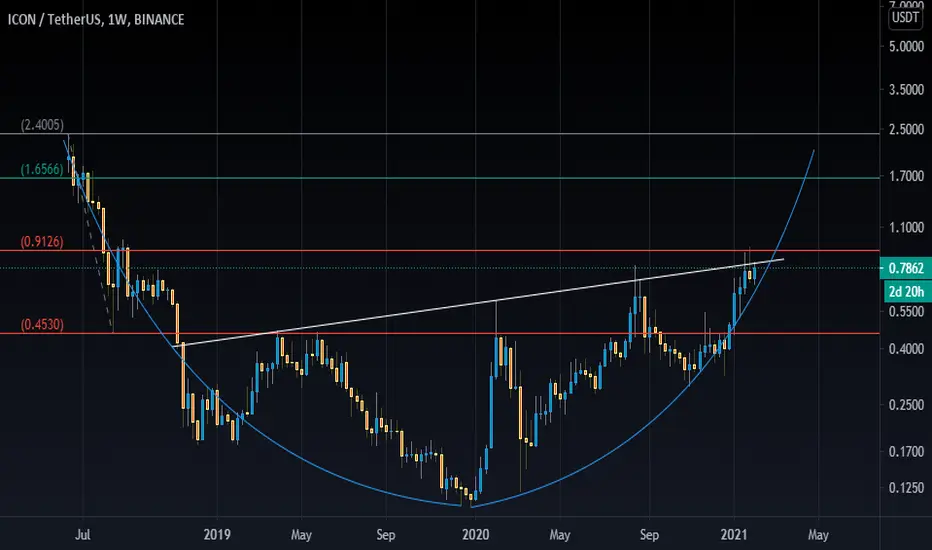
ICX - into a new trend 1 usd Target Hello trading friends,
ICX shows an interesting trend - what could play fine into a long-term trend.
We have seen the first confirmation for the goal target to 1 USD +
This could be the start of the whale trend to build a price action to 1 USD + for ICX - same time always manage your risk in a way that crypto at all gets unexpected trends.
It's interesting to follow ICX - and I think there high chance that we can see soon 1 USD +
Know that there is no garananty into cryptomarkets - all depending on trend study and data.
Have a great day.
@ ICX is for spot and long term
ICXUSDT trade ideas

ICX Trade Going BeautifullyAs I have been posting guys, number 1 most undervalued project and also at bottom support, how easy guys.

ICXUSDT - SETUPICXUSDT Price moving into a rectangle and bulls are trying to make an upside move. The only hurdle in falling trendline is if they succeed to break we can expect a good rally.

ICX - ICON trend chart - LONGHello trading friends,
This is a small view for ICON. (ICX)
Depending on long term ICX looks still interesting - even with the breakdown trend.
The target goal is 1 USD - if BTC keeps going the green trend in the long term - ICX will follow also this trend - ICX could show some power trend lines increase in the coming time.
This project means for spot and long term - know that markets can change with the low time frame - and on this reason always manage your risk.
Have a great day.
@ also there is not always a reason to enter markets before studying the trend including it should depend on your setups.

FORgot farewell with YOUR past trend line?THIS JUST CAN HAPPEN.
Such a move can be expected, but it is not a powerful analysis

ICON/USDTICX is currently holding above a significant level on the weekly, could this be the right entry for the start of its run? ICX is my number one most undervalued coin right now and have been a long term holder including a huge trade profit back in early 2018 selling at $11.00, its currently $0.62. Depending on BTC over the weekend and whether bulls or bears prevail on the two BTC angles I just posted I will be loading up, I expect either a wick dump if BTC does but possibly a weekly close above this line for ICX and on the other hand if the bullish scenario plays out we may enter ICX sooner.


ICXICX has been in a nice little ascending channel since January 22nd, and I think it's once again time for it to test the bottom of the channel. It's a bold strategy, lets see how it plays out for me.
I am waiting for ICX to test, retest and finally reject the range of 0.7949 to 0.8007. If that happens, ICX should Zigzag towards my two targets.
Target #1 = 0.7735
Target #2 = 0.7521
This is my Thesis, targets are purely hypothetical based on my analysis.
This is NOT Investment and/or Trading Advice.
Happy Trades!
❤️ If you enjoy my ideas, Please like/comment, it means a lot, Thank You! ❤️
OKEX:ICXUSDT
BINANCE:ICXUSDT
FTX:ICXPERP

ICXUSDT Technical AnalysisICON lost over 75% value last November 2021 till now. So, what will happen now? The candles are triangle and candles on down-trendline. There are 2 way at the moment. First of all candle will stay on down trendline and keep going to lose value little bit more or recent candle will close $0.75 and next candle will open-close completely above the down trend-line. Then we will have an opportunity for buy. Also one of the candle open-close completely above the support line as well. MA strategies hasn't gave us signal on daily chart, but when we look at the 3 hours chart, it just changed directions and gave us buy signal. We have got an EARLY BIRD signal from our robo advisor @EngineeringRobo couple days ago and if the candles are stay above the middle of the line of Bollinger Bands, it may keep gain more. Our next target might be our resistance line ($0.907). Let's follow our chart closely and don't forget the follow me as well.
"NFA"


ICX LONG POSITION Entry position : buy now or 0.701
Target 1: 0.913
Target 2: 1.121
Target 3: 1.282
Target 4: 1.443
Stop loss: 0.591
Trade type: Swing trade
Exchange: Binance spot
Remember bitcion determines the trend of the market. Trade with caution and wish you luck. Like and follow for more daily trading analysis.

ICXFollowing my biased logic of What goes up, must retrace!
ICX doesn't particularly stand out, I screened it purely on +% change and low volume today. And I don't usually look up if there are any big news for the coin, but today....... I also didn't check the news.
My thesis is quite simple:
#1 ICX is in the Golden Pocket of Fibonacci Extension taken from January 24th
#2 +8% gain in 4 hours without much volume
#3 Barely broke out of the 1H Resistance (now Support)
Clearly ICX is highly speculative at the moment, but I believe it'll retrace to the 0.5 Fibonacci Extension level, which will still be within the 1H Support channel. I'll follow this with a careful trailing-stop all the way down. Expect some turbulence or side action in the Support channels.
Target #1 = 0.5 Fibonacci Extension level
Target #2 = 0.382 Fibonacci Extension level
When in trade I keep to a strict Risk Management plan and keep an eye on BTC
This is my Thesis, targets are purely hypothetical based on my analysis.
This is NOT Investment and/or Trading Advice.
Happy Trades!


Something to keep an eye onMacro is one thing, TA is another. If btc and the whole market does get rekt by jpow or russia being egotistical. I think ICX should bounce off this level and "trend" support.

ICX - DCA LONG TERM CYCLE from 0,66+ until 3 usd +Hello trading friends,
This is not a day trade update, this update is for the long term and DCA UPDATE for ICX.
Expecting in the long term that ICX has much to show into trends, and as we are now into breakdown trends of more coins, is this a great time for ICX.
When all people talking about it, know it's into the hype, and when people leave the coins is the moment to watch the trends.
Long term goal ICX still on 3 USD +
- Into the chart, you see more blue line trends, which means every time price goes higher, depending on DCA a buy, and same time when a trend return to a line a new buy trend, so its a small investment trend with long term vision and split of amounts, as the DCA should be on any coin.
Yes most of the coins are into breakdown trends - and this is the moment to get watch the red trends, also if prices go down for DCA it should be not a problem, as you never invest 100%. the goal is to get at long term a really good trend price action what will result in good % +
Have a great day.
@ this is not a trading call to buy ICX or any coin, study always your trend and make your trading setups.

ICON (ICX) - THE TOP DIP BUY TRENDHello trading friends,
There are more coins that did breakdown depending on the last BTC trend - and depending on the green cycle BTC is still not into the long-term breakdown trend as we have not confirmed the important zones.
ICX is a coin that is interesting in the long term, and I expect there will be a time that we can see the good trend on it '
Depending on long-term cycle green - even 3 USD + is a possible trend. and the price are now 0,70
Why this chart?
This is not a trading call, manage your riks and trade depending on your setups - it is a trend chart to show you the best reader, that this coin could show interesting trends coming time, and depending on TA its on top dip buy coins, even if it breakdown more it's still interesting long term.
Have a great day.

Wolfe wave ICONWolf wave pattern Appeared..
To be honest we should wait for reversal pattern on wave 5 to confirm it ..
But i bought it from 0.7
Breaking wave#5 = stoploss 🔴
Just an idea not Financial advice nor a signal

ICXAs we can see that Bullish pattern has been broken out, and now we are gonna wait until the aad pattern will be created. Then I will buy on it


Red Weeks for ICTICTUSDT has broken its uptrend channel in the weekly timeframe, and also EMAs are showing a downward trend, so we may see a further decrease in the price for this Crypto in the coming weeks.


Big symmetrical triangle on the dailyHello Tradingview friends,
Today I'm going to cover ICON ICX/USDT pair which looks like it's forming a symmetrical triangle.
ICON Project:
The ICON Cryptocurrency (ICX) is a cryptocurrency network that was launched in 2017 by a company based in South Korea. ICX is the associated cryptocurrency token or coin. ICON is actually a complete blockchain network, with the primary purpose of facilitating the connection and interaction of various blockchain software programs through the ICON network.
ICON aims to serve as a sort of a blockchain hub or a point of connection. The company is addressing an important need in the growing field of blockchain technology. One of the challenges for the widespread adoption of blockchain technology is that each separate blockchain community uses its own network. Therefore, the ability to connect the various separate networks is a major step forward in blockchain technology, which is increasingly being used as a more secure mechanism for the transfer and/or storage of all types of data.
Technical analyses:
It looks like ICX is forming a big symmetrical triangle which most of the time is a continuation pattern. So how can we decide if it's true and what clues can we find to confirm this thought? A symmetrical triangle is formed by an initial wave 1 or A up (could be down in a bearish trend and up in a bullish trend), followed up by a wave A down, ABC up and another wave C down to complete a big ABC correction. Right now we would be at the end of wave C. This sequence forms the triangle as you can see on the chart.
The clue that got me triggered is the "hidden bullish divergence" (green line) and the traditional "bullish Divergence" (pink line)
Hidden bullish divergence is when the price makes a higher low but the indicator (RSI in my case) makes a lower low and in this case showed that ICX was oversold at 0.9 ICX/USDT.
Bullish divergence : is when the price makes a lower low but the indicator is showing a higher low. So in both cases, they go the opposite direction.
This divergence makes a good case and could confirm my thought about this triangle.
IF ICX breaks the upper resistance the target would be ICX/USDT 4,76 which is a 357% upward potential.
I hope this is useful for you and it helps you to confirm your own thoughts. I'm just another guy trying to make some money. #DYOR
Good luck!
