ICXUSDT Technical Analysis
⏳ Spot
💎 ICXUSDT had formed a Bullish Flag, after the breakout it has formed a symmetrical triangle, It is expected that after the breakout above the triangle it will continue the Bullish move.
🌐 Tradingview
💵 Invest Only 5% of your Portfolio
🎳 Entry Now or From 2.114 to 2.177
☕️ TP1 2.240
🍺 TP2 2.323
🍻 TP3 2.400
🍾 TP4
🍷 TP5
🍸 TP6
🍹 TP7
🎁 TP8
🚫 SL 2.046 to 2.114
Good Luck 🎲
Check the Links in Description and If you LIKE this analysis, Please support our page and Ideas by hitting the LIKE 👍 button. ❤️ Your Support is really appreciated! ❤️
Traders, if you have your own opinion about it, please write your own in the comment box. We will be glad for this.
Feel free to request any pair/instrument analysis or ask any questions in the comment section below.
We will have more FREE forecasts in TradingView soon
Have a profitable day 😊👍🏻
ICXUSDT trade ideas

ICX ICX may be just in one big weekly cup and handle ready to explode back to $12 like when I sold it last bull cycle??


ICX ICX / USDT
On high time frames printed ascending broadening wedge pattern
Possible playout if support zone hold
Chart is clear with important levels
Hope this idea will help who's interested in this coin
Best of wishes

ICXAs shown in the chart the candle touch the demand area
Entry, Target and SL are shown on the chart

ICX/USD a 55% upside potentialIt looks like we are right at the bottom before the massive rally. I'd expect a 40-50% upside moving within a relatively short period of time.

$ICX ICON all-time HIGH in the making$ICX ICON
Unlock the Internet’s true value
Spend, save, earn, & trade ICON’s cryptocurrency ICX & many more through user friendly applications.
If the former resistance as support holds ICX Icons looks far higher.
Red lines broke idea fails. Take profits on the road.
DYOR and please let me know what you think (feedback)

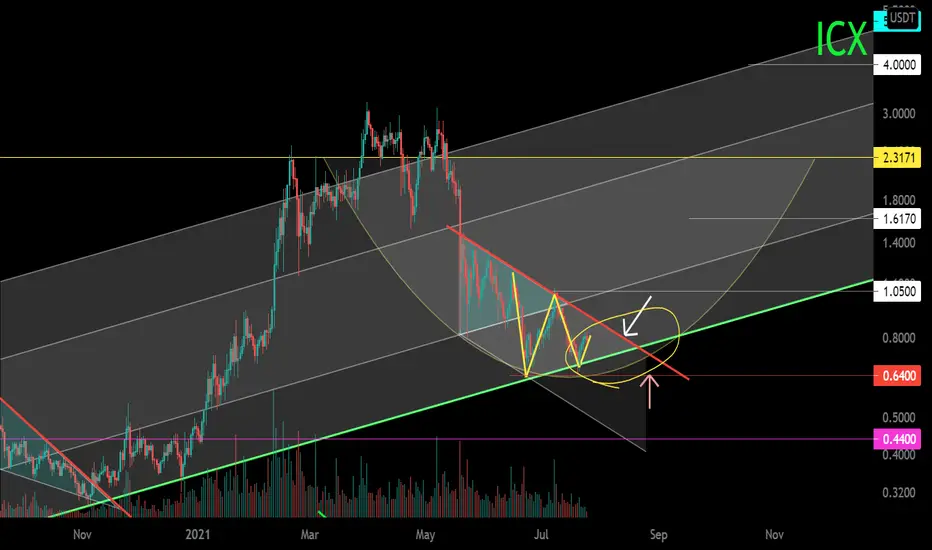
ICX/USDT Mid-Term Trading. Channel. Potential cup.Timeframe 1 day. Important reversal or trend continuation zone. The price is now in the lower part of the uptrend channel with a large step, which has formed a secondary trend.
The coin has been in a downtrend since May, currently in the lower part of the large channel. A local double bottom has formed in this area, which in the case of a breakout of the downtrend resistance will become a local reversal formation.
A breakout of the zone of the local high level of the top and preservation of the upward trend will give the potential to form a cup in a large channel.
The price's breakthrough of the dynamic support of the uptrend (green) and fixation of the price under it (continuation of the downtrend) will give the potential to work short to the level shown in the zone. It is worth noting that even after a 2-month correction, the price is now about +400% of the average values of the "smart money" set.
ICX/USDT Main Trend (Part) Timeframe 1 week

ICX/USDT TRADE SETUP! Hello everyone, if you like the idea, do not forget to support with a like and follow.
ICX looks good here. Already broke out from the falling wedge-like structure and currently retesting it. Also, here is a 50D MA and 100D MA support. So I'm buying some here.
Entry range:- $2.0-$2.08
Target1:- $2.164
Target2:- $2.262
Target3:- $2.348
Target4:- $2.44
SL:- $1.88
Leverage:- 3x-5x
If you like this idea the do support it with like and follow.
Also, share your views in the comment section.
This isn't financial advice. DYOR before investing.
Thank You!


ICX is ready for somethingI've recently started to use bollinger bands width because in certain situation it can be very meaningful and quicker to use than normal BB. The points I highlighted had similar BBW after an uptrend. After such squeeze there was another one pump but stronger. I don't know if my use of this tool is correct but in any case RSI is showing a little bullish DIV at 4h and VLPR is below current price, it's enough to make me think this is going up.
As you can see my support line at 2.16 held already so that support is consolidated, I'd use it as stop loss if I were to enter. I think this is a good entry point.
Good luck

ICXUSDT , The price is squeezingHello everybody
According to this analysis , you can see the price is squeezing and its ready to jump to new target over 3$
But we have a resistance area that shown on chart
We think the price should one more time again come to impact to the trend line area then it can be ready to jump
We can wait until the price come to our buy zone area or if it can close the daily candle above of the minor resistance we can buy some of it
Dont forget use stop loss and attention to money management
Be with us and sleep comfortably
Good Luck
Abtin

#ICXUSDT 7/21 #ICXUSDT Risky (Long Term)
Buy : 0.94080000 - 0.80584248
Target 1: 0.98488000
Target 2: 1.05008000
Target 3: 1.64640000
Target 4: 2.35200000
Stoploss: 0.78520586
Signal R/R: 10% / 150%
Net ROI : NA%
Invest / Position Size : 3%
Exchange : Binance , Bittrex, KuCoin,
Duration: 15-90 days
Confidence in Trade : NA
Analysis :
we ask Allah reconcile and repay.


ICX BREAKOUT SOONICX Breaking Out of descending channel and moving towards next rally🔥
~ @fortunecrypto100 ❤️🌻


icxusdticx is making a bull flag . we will wait for the price to come to the support of the flag or enter after break out and retest . if come to support of the flag it could be a very good entry as there is support MA 50 also.right nnow its on support of 13 and 21 ema on daily
NFA DYOR

icx 10x BULLISHinteresting chart for ICX:ICON with the cup and handle form will hit 10X during the bull run
Let me know your thoughts!

ICX cup and handle pattern$ICX is currently forming a huge C&H pattern. A breakout of the pattern should result in new highs and ultimately new ATH's.
The targets are the red boxes (based on fib extensions).
Targets:
- $4.7
- $7.35
- $9.9
- $12.5

ICXUSDTicx icon: elliot wave analysis according to fundumantal news targets like 13$ the previous ATH is accesible but i expext 4.5$ in the next step

11 day cyclesInteresting 11 day reversal cycle on ICXUSDT. Near the 11th day of every downturn, accumulating ICX seems like a decent idea.
