Up-Trend for ICX!!!!!!!As you guys can see at chart I share with you, than you can see we are forming cup and handle. My first target for # ICX is at $4.7 and I have two more targets. I'll publish two others when target nr.1 hits. Do you have any idea leave a comment. thanks.
ICXUSDT trade ideas

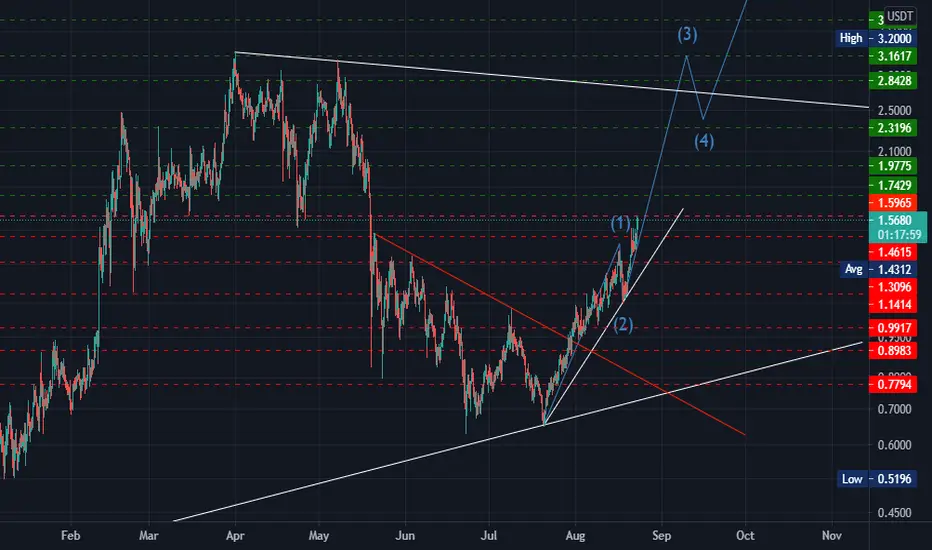
Price prediction ICX 20-09-2021 2.80+ - THE MOON COIN - ✅ICONHello trading friends,
✅This is a new chart with expecting for ICX coming weeks, and of course, the target can hit before.
There is great trend news that allows this coin to be one of the best increase coins coming from TIme. and don't forget the effect of this coin into 2017.
The coin is better, changed in IE blockchain trends, and the new version OF ICON.
Our expecting are 2.80+ into next 3 weeks or before.
🚀✅The same we did also before with IOTX and it did Hit 200%
✅And also with DENT
✅we have done this challenge also before with WABI from 02-08 until 31-08 and it did hit exactly our target as you can see here below:
✅Also with doge to 0,30+
✅And also with Helium to ATH
Have a great day
- - - - - - - - - - - - - - - - - - -- -- - -- - - -- - - - - -- - -- - - - -- - - - - - - - -- -
✅Like and subscribe to not miss a new idea!✅ Thank you
Manage always your risk, nobody knows the future - all depending on Data, trends, and whale effect
All our charts are not advice and you are responsible for your own investment
🎬To stay updated check always our last update.


💎ICX -ICON READY FOR NEW HUGE INCREASE TREND - DATA SHOWSHello trading friends,
We have done before more than 100% increase coins as Doge, dent, Xrp, and last one IOTX. and today we share a new possible 100% increase coin - ICX with the new blockchain update - its seems depending on data that this coin has a huge trend to increase coming time and wroth to hold.
✅Targets
We expect a 2.80+ price target with a possible 100% increase trend for ICX coming time.
Have a great day
- - - - - - - - - - - - - - - - - - -- -- - -- - - -- - - - - -- - -- - - - -- - - - - - - - -- -
✅Like and subscribe to not miss a new idea!✅ Thank you
Manage always your risk, nobody knows the future - all depending on Data, trends, and whale effect
All our charts are not advice and you are responsible for your own investment
🎬To stay updated check always our last update.

ICXUSDT - WATCH 🔥ICX is testing major resistance, we can reject at first and then i expect us to move to the next major resistance marked on the chart.
Thanks for taking your time to check out my idea 😎😎! Often, my ideas are fast gone from the front page because there are so many ideas on the platform and the algo picks the one with more likes 🤖🤖. I think once I have around 20 likes/idea my idea will be shown in front 🥳🥳. It would be awesome if you could like my idea, (only if you really like it of course) 🤪! I believe that the more we can interact with each other, and share thought about an idea, the more we can learn! 👩🏫🧑🏾🏫👨🏻🏫
Furthermore, I made a challenge for myself, I will add 1 idea for every new follower🦹♀️ So if I have 1 follower each day, I will add 1 idea. If I have 10 followers, I will add 10 🏌️♂️ It’s fun for me and you! More followers = more ideas = powerful community! 💪💪💪 Besides, all the ideas are … FREE 🥳🥳🥳
⚠️⚠️ If you want to know how my previous ideas played out, > push the play button on my previous ideas and check it out 🕵️🕵️
Is there a ticker you want me to look into? Let me know in the comments below ⬇️⬇️⬇️

ICX Looking to breakoutICX is looking to breakout here and is terribly undervalued. I don't expect these levels to be around much longer.


ICX UpdateCurrently at the top of the 3day ema ribbon, the top of the weekly ema ribbon, and right under the log growth curve. As you can see, ICX has used each of these indicators as support/resistance multiple times. ICX/USD looks like it's either about to rocket up or get sent back down to the gulags. Either way, big move coming, personally I'm bullish but cautious.

ICX - longNOT A FINANCIAL ADVICE!!! in my opinion Icx will be in bullish .because their chart show that us these coin would be in bullish channel. but everything based on BTC


ICXUsdt can be going up soongood position and start elliot wave and can do it this analyse can going for new top
pls check others idea adn enter position
but i think icx big move start
GL
Supports:
1.4615
1.3096
1.1414
Resistance:
1.5965
Targets :
1.7429
1.9775
2.3196
2.8428
3.1617
3.6809
Targets fro HODL:
4.8617
6.0040
GOAL:
7.7707
GL guys
ICXUSDT - Long - Potential 44.16%ICXUSDT - Long - Potential 44.16%
Exchanges: Binance, Huobi.pro
Signal Type: Regular (Long)
Entry Zone:
1.2718 - 1.4025
Take-Profit Targets:
1) 1.5077
2) 1.6959
3) 2.0132
Stop Targets:
1) 1.0875
Entry Trigger- On a slight pullback (may extend after breaking overhead resistance), ICE airdrop 24th August

ICX|USDT👩🚀Hey hey my friends👋
ICX here is super bullish, finally flipped this strong resistance level with decent volume we have our bids set and ready for the re-test entry

ICX UpdateICX has had a good run the past week, but now faces the 200 day MA which has acted as resistance previously. A break above and we can make some nice moves.

Icx moon#ICON $ICX has a few blockbuster months ahead. $ICE airdrop, $OMM release on Aug 24, #ICON 2.0 migration at 87% & climbing, BTP integrations w/ $NEAR, $DOT, $ONE & $BNB ecosystems in full flight. I believe we will soon see $ICX priced alongside other top peers in this space.

ICXUSDTPurchase order for ICXUSDT currency in time frame daily and it is better to use step purchase.

ICXUSDT BULLISH SIGNAL UPDATE!!As you all know, ICX is not performing well from last 2 months and according to the Chart patterns, Ascending Channel is formed, Breakout formation and also indicators giving bullish signal.
Short term Trade, DYOR Before taking trade, as i'm not responsible for your loss.
RISK FACTORS:
Market/ BTC CRASH
Happy Trading :)
Good Luck!
If you like my idea, please support:
Binance Smart Chain ( BSC ): 0x69Ea86D0f6B762fC36A322b0C833D2bd04534b3d

ICX/USDTBuy Around 1.15$ - 1.20$
Selling Targets:
1️⃣ Target: 1.3560$ = 13% Profit
2️⃣ Target: 1.5800$ = 30% Profit
3️⃣ Target: 1.8600$ = 55% Profit
4️⃣ Target: 2.1500$ = 80% Profit
🔻12h Close below : 1.05$ = 15% Lose
Signal Type: Short-Term⏱1/3, W
2021/08/14🗓
#Risk/Reward: 1/5
🏦Ex: Binance/Spot
🧩Capital 5% or 10%
📊#Technical_Analysis_by_Phoenix

Uptrend line TEST & Entry point!! 58% Folks,
Here is the view on the ICX/USDT chart..
We see a very nice uptrend that has been testing and rejecting higher prices at the top of the uptrend line.
This has happened multiple times.. It tests and rejects, price declines (around 10%) and gets up again..
What is the probability of that happening soon again?
We are at that point of testing again. When it drops down between $1.20.-/$1.22.- I am interested in buying...
Because it shows great strength and has a 'proven' track record in the sentence of the uptrend line testing, rejecting, and making higher highs and lows..
Definitely a bullish trend... So be ready to ride the wave!!!

ICX is bullish! First target $1.5
Buy at current price. Take profit at $1.5
Long term target previous all time high


ICXUSDT bullish/Bearish setupICX completed W pattern and testing major resistance at 1.19. Now observe price action, if price fail to break the current red zone then open short scalp position or wait for the breakout and red zone support confirmation. All above major resistances and support area are given so trade accordingly.
Disclaimer: Not a financial advise. This is purely for educational purposes. Good luck and happy trading!
