🚨 Trade Update: ICX/USDT (3-5x)🚨 Trade Update: ICX/USDT (3-5x)
📈 Long Entry: 0.1490 - 0.1690
OTE (Optimal Trade Entry): 0.1570
SL: 0.1390
B/E Move: When it moves close to TP2
TPs:
Short Term: 0.1720 - 0.1750 - 0.1790 - 0.1850 - 0.1920 - 0.2050
Mid Term: 0.2200 - 0.2400 - 0.2700 - 0.3000
**Disclaimer: Past profits do not guarantee future results.
Is there a risk? Of course. The whole financial market is subject to risk; any fundamental reason or sudden change in the market sentiment can reverse the current market dynamic and cause a loss. Do not take excessive risks which you cannot afford to lose. There is no obligation to take this trade; please avoid the trade if you disagree with the trade analysis.
EDK FORUM TRADING®
ICXUSDT trade ideas

ICX/USDT longDirection: LONG📈
Reasoning: Decrease in bearish momentum and retest of mid term support
ENTRY: 0.149 - 0.169
OTE: 0.157
TARGETS
Short Term: 0.172 - 0.175 - 0.179 - 0.185 - 0.192 - 0.205
Mid Term: 0.22 - 0.24 - 0.27 - 0.30
STOP LOSS: 0.139

ICX SHORT SETUPHi, dear traders. how are you ? Today we have a viewpoint to SELL/SHORT the ICX symbol.
For risk management, please don't forget stop loss and capital management
When we reach the first target, save some profit and then change the stop to entry
Comment if you have any questions
Thank You

✴️ ICON 200% Target Potential MappedICON (ICXUSDT) managed to closed above all of the moving averages last week but one, EMA200 (purple).
Today, current session, ICXUSDT is moving above it and this open the doors for explosive, fast growth.
MA200 is also relevant as a moving average and was conquered as resistance just 5 days ago.
The entire setup is pretty strong because we not only have the moving averages being left behind but the trading volume is obviously leaning towards the buy side, not to mention the ascending channel (higher highs and higher lows).
We have mainly two targets in mind, 113% and 210%. This can happen fast if ICXUSDT manages to close above EMA200 today.
That's all.
Thank you for reading.
Namaste.

ICXUSDTHello Crypto Lovers, This is a 1D frame analysis for ICXUSDT As we can see, the price has come back to its resistance line and we can consider two scenarios. Scenario one: it is possible that the price will not be able to settle above the first resistance line and we should consider a pullback. Scenario two: if the price is able to settle above the first resistance line, it can move towards the resistance zones. If it is able to break and settle above the resistance line, those who do not want to take more Warning: This is just a suggestion and we do not guarantee profits. We advise you to analyze the chart before opening any positions. Take care

icx did 20%As mentioned in previous ICX chart idea that you can go Long on breakout. And now it did 20% after breakout and 12% profit after retest

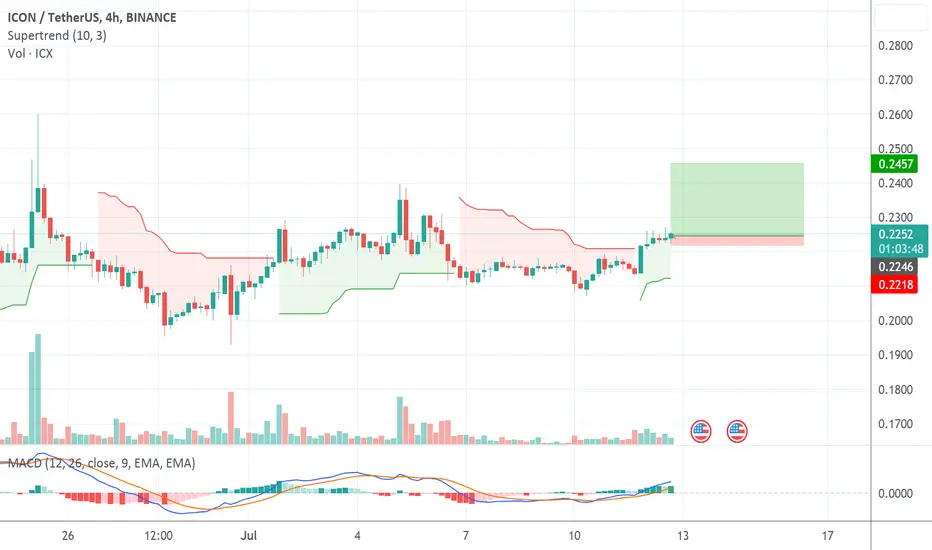
Quick ScalpLooking a good deviation and i have entered in long here for a scalp towards 0.2350.
might bounce towards this level fast.
Note: Not a finished advice.

ICX 4H chart Icx chart is very clear and we should wait for breakout and long incase of retest. And there are two support lines if we got rejected from red box resistance. Keep eye on it


TOKEN TO WATCH | ICX | Sepolia Bridge Potential 24% TargetTOKEN TO WATCH | ICX | Sepolia Bridge Potential 24% Target
There is still some time left in May for this news to take hold although it is a little irrelevant as this is opening the doors to some bigger potential. With usual biggish news announcements and launches we can see dumps although longterm it is only a positive and can see the price drive up. The complimenting factor here is that we are also seeing some pretty nice technicals lining up although need to wait for a break of the key trendline

ICX ANALYSIS (4H)Hi, dear traders. how are you ? Today we have a viewpoint to BUY/LONG the ICX symbol.
For risk management, please don't forget stop loss and capital management
When we reach the first target, save some profit and then change the stop to entry
Comment if you have any questions
Thank You

ICX: is it still alive?I've stopped to follow ICX but today I ended up on a DEX where years ago I moved a small bag of them I own, so I went back to check the chart. I know ICX blockchain is used in Korea (for ID cards or something like that) but I really have no idea if there are chances for another run. Anyone knows something?
Assuming history will repeat (I'm not a big fan of this theory but it's the only think I can suppose right now) I foresee two options:
1) orange forecast: based using the highest volume on the weekly as a pivot for the upcoming rise of price
2) blue forecase: based on time from last peak and ruling out the big dump between the two weekly peaks
If scenario 1 is right we should test ATH in June 2024 while if the correct scenario is the number 2 then 2024 will see an uprise of prices but it should take 2025 to get to past ATH and probably 2026 for new highs.
I tend to think that scenario number 2 is the more likely assuming ICX is not a dead coin.
If anyone of you is informed on this coin please share your knowledge.
Thanks

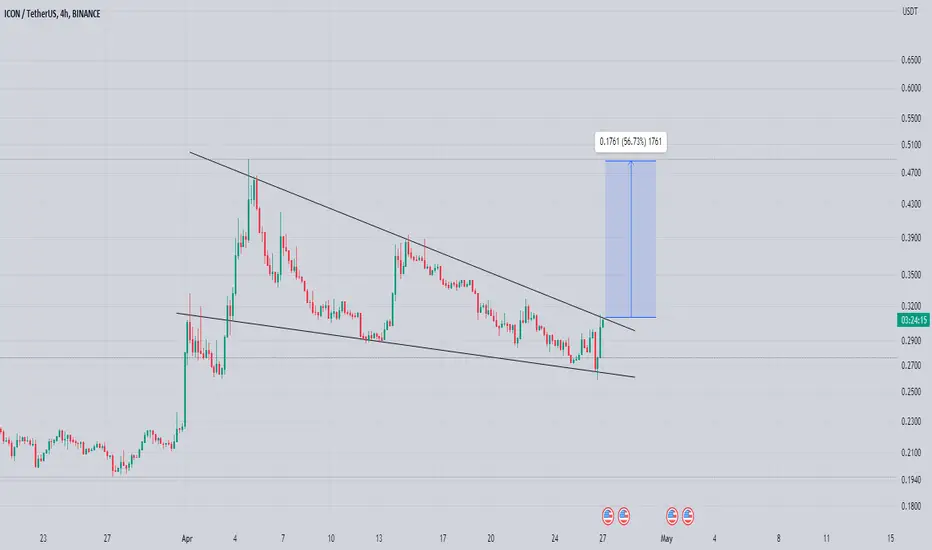
ICXUSDT wants the breakout?
ICXUSDT is currently exhibiting a descending channel pattern. A descending channel is characterized by a series of lower highs and lower lows, indicating a bearish trend.
According to Plancton's rules, a potential trading strategy could involve waiting for a breakout from the descending channel before considering a new long position. A breakout occurs when the price breaks above the upper trendline of the descending channel, suggesting a potential shift in market sentiment and a possible reversal of the bearish trend.
However, it's important to exercise caution and confirm the breakout with additional technical indicators or price action analysis before entering a long position. False breakouts can occur, so it's crucial to verify the validity of the breakout signal.
Once a valid breakout is confirmed, a new long position could be considered based on Plancton's rules. This implies that the trader expects the price to reverse its bearish momentum and potentially enter an uptrend.
–––––
Follow the Shrimp 🦐
Keep in mind.
🟣 Purple structure -> Monthly structure.
🔴 Red structure -> Weekly structure.
🔵 Blue structure -> Daily structure.
🟡 Yellow structure -> 4h structure.
⚫️ Black structure -> <= 1h structure.
Follow the Shrimp 🦐

I can enter by breaking the area at the price break above the leI think it is worth the risk
Because it has divergence and the famous double down pattern has reacted to an important level
So what do you think??


ICX ANALYSIS (4H)Hi, dear traders. how are you ? Today we have a viewpoint to BUY/LONG the ICX symbol.
For risk management, please don't forget stop loss and capital management
When we reach the first target, save some profit and then change the stop to entry
Comment if you have any questions
Thank You

ICON (ICX) formed bullish Gartley for upto 124% massive pumpHi dear friends, hope you are well and welcome to the new trade setup of ICON (ICX) coin with US Dollar pair.
Recently we caught almost 33% pump of ICX as below:
Now on a daily time frame, ICX has almost formed another bullish Gartley for the next price reversal.
Note: Above idea is for educational purpose only. It is advised to diversify and strictly follow the stop loss, and don't get stuck with trade

ICXUSDTICXUSDT
Volume 24h - 24-04-2023 IS : HKEX:80 ,758,196 - 330.01%
Rested on the support
Retest the trend now

Icx Getting ready For another bullish Impulse Icx Getting ready for Another bullish impulse Formed Falling Wedge In h4 Timeframe Incase IOf breakout expecting Another 45 to 50% Bullish Wave
#ICX coin #hodl_signal with great profitsmy idea is in forming amazing pattern
Head and shoulders pattern
Coin : ICX_usdt
Frame : Weekly
Buy zone : Among Green line
Targets : Violet lines

Icx weekend rerunwe retested Fridays low if we run back the same way to resistance 10% awaits us in the next 24hr
actually on closer look 0.31cent even is the main tp that's 8%
