ICX CAN GO UPPERHi, dear traders. how are you ? Today we have a viewpoint to BUY/LONG the ICX symbol.
For risk management, please don't forget stop loss and capital management
When we reach the first target, save some profit and then change the stop to entry
Comment if you have any questions
Thank You
ICXUSDT trade ideas

ICON ICX Bull runThese are my thoughts on ICON . They are meant to give you an idea, not trading advice.
These levels should be resistance & support.
Be careful, as the market never gives you certainties, only probabilities.

Today we review ICX. Will it reach the Fibonacci level of 0.618?Hello everyone! Today let's take a look at the cryptocurrency ICON.
At the beginning of April, the asset had a rapid growth, resulting in a 130% increase in price, breaking the strong Fibonacci level of 0.236 and further 0.382. However, the asset failed to consolidate above the latter and began to correct.
Currently, the asset is approaching the Fibonacci level of 0.238, where the uptrend line is also located.
Therefore, it is possible to look for an entry point to a position in the range of $0.28-0.29.
The targets are the next Fibonacci levels at $0.46-$0.97 (+57%, +230% profit).
This is not a financial recommendation, and everything you do is done at your own risk.

ICX, preparing for a new flight..ICX, after a significant correction and touching the order block support at 0.30 is now ready to reverse on the upside.
SEEDED L at 0.315
TAYOR.

ICX - Risky short into big longHTF TR Pocket extension, volume gap resistance with liquidity (if there are any left)
Wave 3 of 3? might also be nearing an end, so i'll try a small short. However, I can see how many people will try shorting it, so going with a small amount just to brag if I'll be right.
Mostly interested in longs, so if the pullback comes with 4h+ divs, will take it blindly. FUD in the market would be extra flavour.

CON (ICX) formed bullish Gartley for upto 73.50% rallyHi dear friends, hope you are well and welcome to the new trade setup of ICON (ICX) coin with US Dollar pair
Previously I shared a long-term trade setup for ICX, which is still in play as below:
Now on a 4-hr time frame, ICX has formed a bullish Gartley move for another price reversal.
Note: Above idea is for educational purpose only. It is advised to diversify and strictly follow the stop loss, and don't get stuck with trade

#ICXIF 0.34 is borken that analysis will be canceled. Next week we will have mega alt bull. So think about it.

ICX longwaaSUP everyone, i just put on a long trade on ICX based on the probability below on the 144 minn TIme Frame
1.hit the 0.706 fib retrace,
2 low on the stoich rsi,
3.low on the mac d wanting to curl up
4 histograms curling up into the green
5 money flow curling up into the green
6 hidden bull divvy
7 measured move to a resistance area at 0.59
However Moving averages are low down and needs to bounce which it looks like it is doing.
Anything can happen, probability is key

🔥 ICX Oversold Bounce After Massive Run-UpICX has been one of the major winners of the last week. However, price action has been negative after topping out around $0.48.
With BTC seemingly bouncing, it seems that ICX is primed for a huge upward move, just like we saw a couple of days ago.
- ICX has hit hourly oversold for the first time in weeks. Hourly oversold in a strong uptrend is a great moment to enter.
- ICX has bounced off the 0.618 Fibonacci Retracement line, which is often a strong resistance.
I'm aiming for the orange and red lines as my targets (0.40 and 0.433)

Let's cover everything about BTC and what ALTs to trade.This kind of structure is in a lot of uncertainty but we still can find gem on this random price action.


Icx Coin Analysis Seems Like Icx Has already bottomed Out
Formed descending channel & Building Up for Massive Breakout Incase Of successful breakout expecting 280 to 300% bullish Move

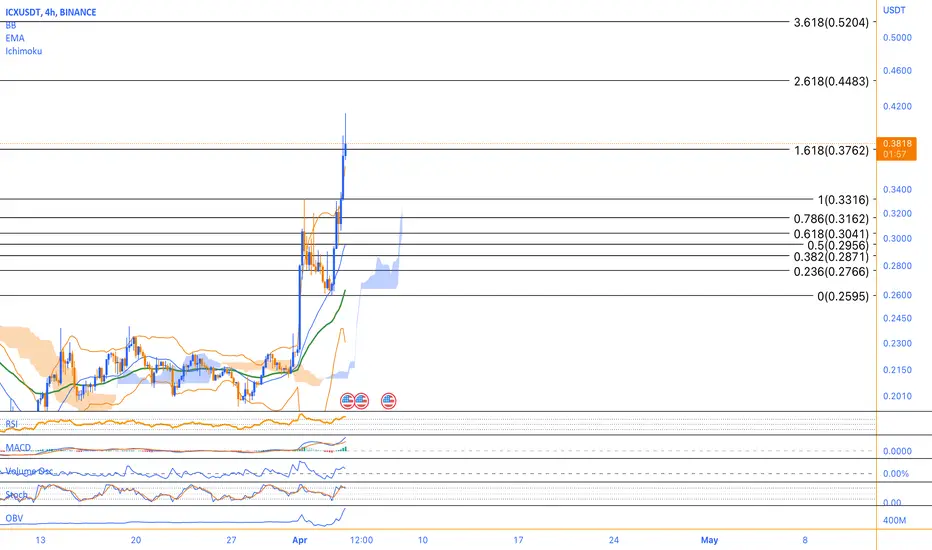
Overbought and Ready for a Potential Price Reversal?ICX is trading at a current price of $0.3800. The analysis is based on a 4-hour timeframe. The Relative Strength Index (RSI) is at 80, indicating that ICX is in overbought territory, which could potentially lead to a price reversal.
The Fibonacci retracement levels for ICX are as follows: 0 Fibonacci at 0.2595, 0.5 Fibonacci at 0.2956, and 1 Fibonacci at 0.3316. These levels can be used as potential support and resistance levels for ICX.
The upper Bollinger band for ICX on the 4-hour timeframe is at 0.3600, while the lower Bollinger band is at 0.2308. The middle Bollinger band is at 0.2954. Bollinger bands are used to identify potential overbought or oversold conditions, and when the price is near the upper or lower bands, it may indicate a potential reversal.
The volume oscillator is currently at +26%, which suggests that there is significant buying activity for ICX. The Moving Average Convergence Divergence (MACD) is at 0.0285, which is positive, indicating that there is positive momentum for ICX. The stochastic oscillator is at 79, which is relatively high, suggesting that ICX may be overbought.
The hourly exponential moving average (EMA) 50 is at 0.2630, which indicates that ICX is currently trading above this level. This could be a positive sign, but it also means that the price is further away from potential support levels.
Local support levels:
0 Fibonacci at 0.2595
0.5 Fibonacci at 0.2956
Lower Bollinger band at 0.2308
Local resistance levels:
1 Fibonacci at 0.3316
Upper Bollinger band at 0.3600
These levels can be used as potential entry or exit points for trades and can also be used to identify potential price targets.
Overall, the technical indicators for ICX suggest that it is currently overbought and may be due for a price reversal. However, the positive momentum and buying activity indicates that there is still potential for the price to continue to rise. Traders may want to watch for potential support levels at the Fibonacci retracement levels, as well as the lower Bollinger band, to identify potential buying opportunities.
ICON ICX price rising and knows no grief) Who is pushing it up?The fact that the trading volumes of the ICONUSDT pair have grown significantly since the beginning of the year clearly indicates the increased interest of "big money" in the project.
What's going on there? Share your thoughts in the comments.
In our opinion, the main price intrigue on the ICONUSDT chart will take place in the region of $0.42-0.43
In this price zone, it will be clearly visible whether buyers will be able to break through and continue the growth of the ICON price above $0.60 in a short time.
Or is it possible that a correction to $0.28 is needed to continue the "healthy price growth" and only then will the price rise to $0.60 and higher
_____________________
Did you like our analysis? Leave a comment, like, and follow to get more

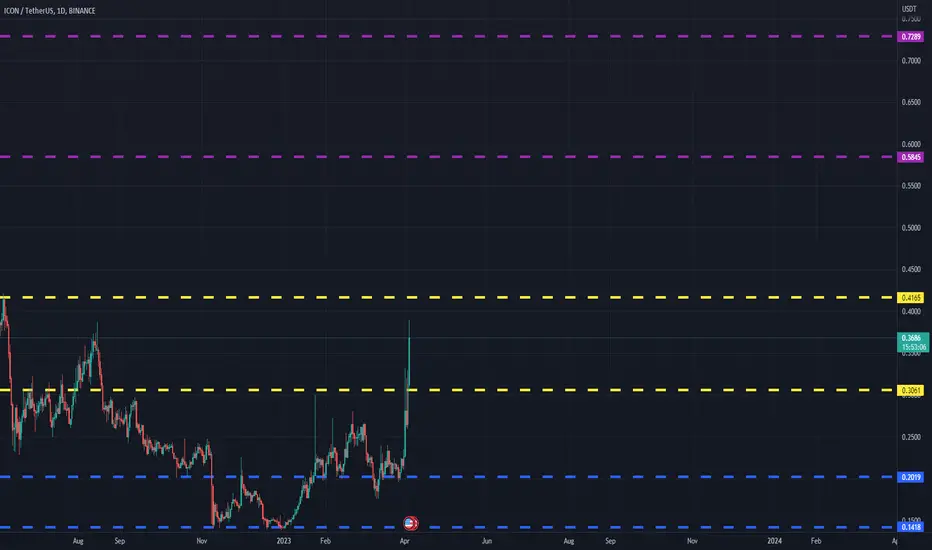
ICXUSDT(ICON) Daily tf Range Updated till 04-04-23ICXUSDT(ICON) Daily timeframe range. it had a clean break through #0.3061 now a free space till #0.4165 and already close to that. the daily candle is as healthy as it gets. a little bit of more can help it to cross #0.4165 which can lead it too upper levels.
ICX - Facing Resistance ICX is struggling to stay above the $0.30 level. It is also overbought on the daily which could be signaling some weakness in the trend. If we get a full retracement from these levels the 0.618 around ($0.21) could be very key for the trend. A candle break above $0.30 could negate this bearish thesis.

ICXIdea: The price broke the daily 200 EMA. The price is in a very strong overbought zone. The price will drop to 200 EMA for a retest, then continue the uptrend

ICX : ICNREASE VIEWICX is showing some increasing trend on a low time frame.
We will follow this trend to see if it's able to confirm.
It's a long time ago since ICX did show a new increase.

ICX Short TradeTaking this leveraged short trade to hedge my longs, with half position.
Expecting at least one more lower low in the H1 timeframe, which is enough to grab the 1st target and zero the trade´s risk.

ICXUSDT is testing the 4h resistanceICXUSDT has recently experienced a breakout from the daily resistance level, which was then successfully retested as new support on the 0.5 Fibonacci level.
Currently, the price of ICXUSDT is testing the 4-hour resistance level. In order for the cryptocurrency to continue its upward trend, it will need to create a breakout from this resistance level and then retest it as new support. This is in line with Plancton's rules for long positions, which suggest that buying opportunities should be sought after a breakout from resistance, followed by a retest of the level as new support
–––––
Follow the Shrimp 🦐
Keep in mind.
🟣 Purple structure -> Monthly structure.
🔴 Red structure -> Weekly structure.
🔵 Blue structure -> Daily structure.
🟡 Yellow structure -> 4h structure.
⚫️ Black structure -> <= 1h structure.
Follow the Shrimp 🦐

ICX / USDT Price Prediction I Think This is The Best Megaphone Pattern Seen in Very Few Live Charts So Perfect.
And Also Showing Double Bottom ( W ).
If ICX Price Break Nearest Resistance With High Volume Then Wait For Retest For Confirmed Entry.
If You Like My Analysis Please Like And Share And Follow Me For More Signals

ICXUSDTHello Crypto Lovers,
Mars Signals team wishes you high profits.
This is a 4-hour-time frame analysis for ICXUSDT
R1 is the resistance area in this chart with their representation of the disability of the price to rise at several points. And S1 used to be a resistance line in the past. At the moment, the price could break S1 upward and has a fluctuation over the mentioned line. By having its fall continued to reach S1, we will have two scenarios available. In case we have some confirmation candles to rise, an increase would be there for the price to reach R1 or by having more fixation over there, more rise is expected then. Also by giving us some falling signs or through moving below S1, more decline would be waiting for the price toward lower amounts. For enjoying less risky trades, we recommend you to obtain every piece of information and details through our analyses and updates.
Warning: This is just a suggestion and we do not guarantee profits. We advise you to analyze the chart before opening any positions.
Wish you luck

Icon vs USDOn this 1-day chart we have a 3-day life cross (150-day moving average crosses the 600-day moving average). We're about to test support, if you're lucky 27 cents, ideally 30 cents - afterwards you'll not catch it - a bit like January 22nd.
Weekly chart, all good - we need to confirm support on the the 21-week moving average (yellow line).
