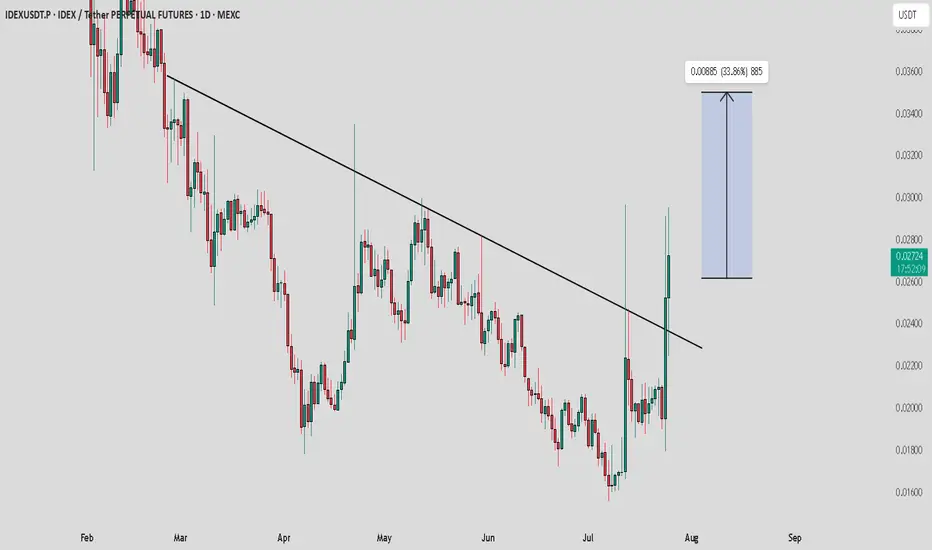
IDEX / USDT : looking bullish in choppy market situationThe overall market is not looking very strong right now, but IDEX is showing bullish potential. It's moving with strong volume and confirming its breakout with consistent bullish moves.
Key Points:
IDEX seems to be breaking out with solid momentum.
Watch for confirmation of continued bullish movement to ensure it’s not a fakeout.
Note:
Manage your risk carefully. Only invest money you can afford to lose. Always Do Your Own Research (DYOR) before making any decisions. Stay cautious and ensure you're prepared for any market fluctuations.
IDEXUSDT trade ideas
IDEXUSDT in a downtrendhi traders.
Today, Binance extended the Monitoring tag to include IDEX.
This token's price has been in a major downtrend for a very long time.
I don't expect it to change with the bad news that came out today for IDEX.
The bounce will be an opportunity to enter a short position.
See the setup on the chart.
Good luck

IDEXUSDT UPDATEIDEXUSDT is a cryptocurrency trading at $0.04942. Its target price is $0.08000, indicating a potential 60%+ gain. The pattern is a Bullish Falling Wedge, a reversal pattern signaling a trend change. This pattern suggests the downward trend may be ending. A breakout from the wedge could lead to a strong upward move. The Bullish Falling Wedge is a positive signal, indicating a potential price surge. Investors are optimistic about IDEXUSDT's future performance. The current price may be a buying opportunity. Reaching the target price would result in significant returns. IDEXUSDT is poised for a potential breakout and substantial gains.

IDEXUSDT 1WIDEX ~ 1W Analysis
#IDEX In Time Frame 1 W re -test this support block. Buy from here if you still have a Conviction on this coin with a minimum target of 20%+

IDEXUSDT: Critical Target Before the Takeoff!IDEXUSDT: Critical Target Before the Takeoff! 🚀
Key Insights:
Essential Pullback: IDEXUSDT is unlikely to continue its upward movement without first hitting this target zone.
Stops in Place: My stop-loss level is set at 0.091, ensuring controlled risk.
Clear Chart Details: All other essential levels and strategies are marked on the chart for easy reference.
Why This Matters?
Markets often respect well-defined levels. Waiting for the pullback ensures entries are made with precision, reducing risk and increasing potential upside.
Final Note: Don’t rush into trades; let the market come to you. Patience always pays off.
Does this strategy align with your approach? Boost, comment, and follow for more insights on mastering the charts! 🌟
Let me tell you, folks, this is amazing. Nobody does analysis like I do. Believe me. If this helps you, don't forget to boost and comment! It’s a big deal, motivates me to share even more winning insights with you. Tremendous insights.
I keep my charts the best, clean, simple, and clear. You know it, I know it, clarity leads to better decisions. No question about it. My approach? Built on years of tremendous experience. Incredible track record. I don’t claim to know it all, but I spot high-probability setups like nobody else. Trust me.
Want to learn how to use the heatmap, cumulative volume delta, and volume footprint techniques I use to determine demand regions with stunning accuracy? Send me a private message—totally free, folks. That’s right. I help anyone who wants it, absolutely no charge. Unbelievable value.
Here’s the list, long list, great list, of some of my previous incredible analyses. Each one, a winner:
🎯 ZENUSDT.P: Patience & Profitability | %230 Reaction from the Sniper Entry
🐶 DOGEUSDT.P: Next Move
🎨 RENDERUSDT.P: Opportunity of the Month
💎 ETHUSDT.P: Where to Retrace
🟢 BNBUSDT.P: Potential Surge
📊 BTC Dominance: Reaction Zone
🌊 WAVESUSDT.P: Demand Zone Potential
🟣 UNIUSDT.P: Long-Term Trade
🔵 XRPUSDT.P: Entry Zones
🔗 LINKUSDT.P: Follow The River
📈 BTCUSDT.P: Two Key Demand Zones
🟩 POLUSDT: Bullish Momentum
🌟 PENDLEUSDT.P: Where Opportunity Meets Precision
🔥 BTCUSDT.P: Liquidation of Highly Leveraged Longs
🌊 SOLUSDT.P: SOL's Dip - Your Opportunity
🐸 1000PEPEUSDT.P: Prime Bounce Zone Unlocked
🚀 ETHUSDT.P: Set to Explode - Don't Miss This Game Changer
🤖 IQUSDT: Smart Plan
⚡️ PONDUSDT: A Trade Not Taken Is Better Than a Losing One
💼 STMXUSDT: 2 Buying Areas
🐢 TURBOUSDT: Buy Zones and Buyer Presence
🌍 ICPUSDT.P: Massive Upside Potential | Check the Trade Update For Seeing Results
🟠 IDEXUSDT: Spot Buy Area | %26 Profit if You Trade with MSB
📌 USUALUSDT: Buyers Are Active + %70 Profit in Total
🌟 FORTHUSDT: Sniper Entry +%26 Reaction
🐳 QKCUSDT: Sniper Entry +%57 Reaction
📊 BTC.D: Retest of Key Area Highly Likely
And that’s just the start. The list goes on and on, folks. It’s a tremendous list, the best. I stopped adding because, frankly, it’s tiring. So many wins. People are amazed. You can check my profile and see for yourself, winning moves, all the time. Believe me, nobody does it better.

IDEX-USDT | This Crypto will pop as bitcoin falls | BTC HedgeIdex claims to be the first hybrid liquidity DEX that combines an order book model with an automated market maker. It blends the performance and features of a traditional order book model with the security and liquidity of an AMM. Idex takes an innovative approach to decentralized exchanges by combining an off-chain trading engine with on-chain trade settlement. Users benefit from that in several ways.
First, this approach does away with failed trades and wasted money on gas fees, making the trading experience more pleasant and efficient. The instant trade execution means front-running or sandwich attacks are not possible and users can trade without waiting for previous trades to settle. As a result, more advanced order types and trading strategies can be executed since limit orders are possible, opening up arbitrage opportunities with other exchanges.
Idex follows an ambitious roadmap that envisions a multi-chain future for the exchange, which currently runs on Ethereum and Binance Smart Chain. For the remainder of 2021, it plans to launch on second layer solutions and Polkadot and implement a referral. For the future, Idex plans to implement leverage trading and launch on additional layer one and layer two blockchains.

IDEXUSDT 1WIDEX ~ 1W
#IDEX So far it still maintains its bullish structure. If you still have Conviction on the coin,. Buy gradually within this support block,. with a minimum target of 20%++

IDEXUSDT | SPOT BUY AREACurrent Market Context:
While there’s a noticeable increase in buyer activity, the price is in a determined downtrend. This suggests a potential accumulation phase where buyers are preparing to counteract the decline.
Key Observations:
Buyer Strength: Increased buying activity is evident, but sellers currently dominate the price action.
Blue Box Zone: This area represents a potential demand zone or strong support where buyers may decisively step in to reverse the downtrend.
Trading Plan:
Bullish Entry:
Wait for the price to dip into the blue box zone.
Look for confirmation of reversal signals, such as bullish engulfing candles, pin bars, or a higher low formation on smaller timeframes.
Targets:
Initial target: Retest of nearby resistance levels.
Extended target: Move to higher structural levels as momentum builds.
Invalidation:
If the price closes strongly below the blue box, the setup may be invalidated.
Additional Notes:
Volume Divergence: Track volume during the decline; increasing volume at the blue box could confirm buyer dominance.
Stop Loss Placement: Set stops just below the blue box to minimize risk.
This setup requires patience and precise execution.
I keep my charts clean and simple because I believe clarity leads to better decisions.
My approach is built on years of experience and a solid track record. I don’t claim to know it all, but I’m confident in my ability to spot high-probability setups.
My Previous Analysis
🐶 DOGEUSDT.P: Next Move
🎨 RENDERUSDT.P: Opportunity of the Month
💎 ETHUSDT.P: Where to Retrace
🟢 BNBUSDT.P: Potential Surge
📊 BTC Dominance: Reaction Zone
🌊 WAVESUSDT.P: Demand Zone Potential
🟣 UNIUSDT.P: Long-Term Trade
🔵 XRPUSDT.P: Entry Zones
🔗 LINKUSDT.P: Follow The River
📈 BTCUSDT.P: Two Key Demand Zones
🟩 POLUSDT: Bullish Momentum
🌟 PENDLEUSDT: Where Opportunity Meets Precision
🔥 BTCUSDT.P: Liquidation of Highly Leveraged Longs
🌊 SOLUSDT.P: SOL's Dip - Your Opportunity
🐸 1000PEPEUSDT.P: Prime Bounce Zone Unlocked
🚀 ETHUSDT.P: Set to Explode - Don't Miss This Game Changer
🤖 IQUSDT: Smart Plan
⚡️ PONDUSDT: A Trade Not Taken Is Better Than a Losing One
💼 STMXUSDT: 2 Buying Areas

#IDEX (SPOT) entry range(0.031- 0.039)T.(0.08490) SL(0.02896)BINANCE:IDEXUSDT
entry range( 0.03100- 0.03900)
Target1 (0.06390) - Target2 (0.08490)
1 Extra Targets(optional) in chart, if you like to continue in the trade with making stoploss very high.
SL .1D close below (0.02896)
*** collect the coin slowly in the entry range ***
*** No FOMO - No Rush , it is a long journey ***
**** #Manta ,#OMNI, #DYM, #AI, #IO, #XAI , #ACE #NFP #RAD #WLD #ORDI #BLUR #SUI #Voxel #AEVO #VITE #APE #RDNT #FLUX #NMR #VANRY #TRB #HBAR #DGB #XEC #ERN #ALT #IO #ACA #HIVE #ASTR #ARDR #PIXEL #LTO #AERGO #SCRT #ATA #HOOK #FLOW #KSM #HFT #MINA #DATA #SC #JOE #RDNT #IQ #CFX #BICO #CTSI #KMD #FXS #DEGO #FORTH # AST #PORTAL #CYBER #RIF #ENJ #ZIL #APT #GALA #STEEM #ONE #LINK #NTRN #COTI #RENDER #ICX #IMX #ALICE #PYR #PORTAL #GRT #GMT # IDEX ***

Idex/UsdtBINANCE:IDEXUSDT
The **current price** of the asset (Idex) is **0.08639**. 📉 This means the price is currently trading around this value.
The **support levels** are the price points where the asset has historically bounced back from, acting as a "floor" for the price:
- **0.06818** 🛑 (1st support): If the price drops, this level could act as the first line of defense where buying pressure may increase.
- **0.0500** 🛑 (2nd support): If the price keeps falling, this support level is a stronger one that might attract more buyers.
- **0.0300** 🛑 (3rd support): This is a deeper support level. If the price drops to this point, it could represent a significant opportunity for buying, or it could signal a deeper downtrend if broken.
If the price **holds** above these support levels (meaning the price does not drop below them), the asset could **rise** towards the next **resistance levels**:
- **0.011790** 🚀 (1st resistance): This is a key level where selling pressure may appear. If the price breaks through this level, it could signal a move higher.
- **0.01324** 🚀 (2nd resistance): If the price breaks past 0.011790, the next level to watch is 0.01324, which might be a tough hurdle before further gains.
So, in simple terms:
- If the price **stays above the support levels**, it may push higher towards the resistance levels.
- But if it **falls below the support**, the price could go down to the next support zone.
Remember, this is just analysis, not financial advice! 📊✨
---

Idex/UsdtBINANCE:BTCUSDT
---
The **current price** of the asset (Idex) is **0.08639**. 📉 This means the price is currently trading around this value.
The **support levels** are the price points where the asset has historically bounced back from, acting as a "floor" for the price:
- **0.06818** 🛑 (1st support): If the price drops, this level could act as the first line of defense where buying pressure may increase.
- **0.0500** 🛑 (2nd support): If the price keeps falling, this support level is a stronger one that might attract more buyers.
- **0.0300** 🛑 (3rd support): This is a deeper support level. If the price drops to this point, it could represent a significant opportunity for buying, or it could signal a deeper downtrend if broken.
If the price **holds** above these support levels (meaning the price does not drop below them), the asset could **rise** towards the next **resistance levels**:
- **0.011790** 🚀 (1st resistance): This is a key level where selling pressure may appear. If the price breaks through this level, it could signal a move higher.
- **0.01324** 🚀 (2nd resistance): If the price breaks past 0.011790, the next level to watch is 0.01324, which might be a tough hurdle before further gains.
So, in simple terms:
- If the price **stays above the support levels**, it may push higher towards the resistance levels.
- But if it **falls below the support**, the price could go down to the next support zone.
Remember, this is just analysis, not financial advice! 📊✨
---

IDEXUSDT (IDEX) Updated till 08-12-24IDEXUSDT (IDEX) Daily timeframe range. another alt moving very nicely. it got a healthy candle today all it needs a confirm close above 0.09208. which can send it to 0.13350 or above. local support at 0.05434.

IDEX Hits Bottom? Altcoins Dynamics Explained (2,600% BU-Pot.) We are talking about long-term growth...
Here is another one. I will make some examples and then we go through this chart.
Consider Binance Coin, Toncoin, XRP, Sun Token, Solana, Ethereum and those pairs that I shared bearish charts recently and for the past 6 months. The difference is one and one only; that is, IDEXUSDT hit bottom in early August, all those others are trading really high, that's my point.
The ones that hit bottom have the potential for growth regardless of what the rest of the market is doing.
Let's make another example, present chart: IDEXUSDT.
This is the fifth week of consecutive bullish action. 100% green.
Those that I mentioned above, if you look at the weekly timeframe you would be looking at lower highs and lower lows (a downtrend). Here you are looking at an entire month of green.
Now, notice the volume... The highest volume ever!
This is the same signal we spotted on the NULSUSDT pair. We saw really high volume and what happened? Growth is taking place.
Not all charts, not all altcoins are the same.
Some will grow, some will crash while some others will remain sideways.
It is not black or white, nor black, white and gray.
It works like this: Red, Orange, Yellow, Green, Blue, Purple, Brown, Black, White, etc.
Many colors, many choices, many options, many potential results.
Take your time to choose because some will go down while others go up.
You can always visit my profile and confirm your analysis by looking at my charts.
Namaste.

#IDEX Gathering Momentum for a Massive Move Above | Watch OutYello, Paradisers! 😎 Are you ready for what could be a make-or-break moment for #IDEX? Let's discuss the latest analysis of #IDEXUSDT:
💎#IDEX is showing promising signs of a potential bullish continuation from its key bullish order block (OB) at $0.0303. The price action is hinting at a push higher as momentum builds, aiming for a breakout from the descending channel.
💎Yet, for this bullish momentum to fully hold, it must conquer the internal resistance at $0.043. Only then can we consider this move a confirmed breakout, and until we see decisive strength here, the risk of entering trades too early remains high. Waiting for strong engulfing candles and consistent upward movement is essential to confirm the bulls are truly in charge.
💎We’re not in full breakout mode just yet, and the risk of fading momentum is ever-present. If #IDEX fails to break above $0.043 and starts to weaken, the bearish scenario could come into play. Sellers may begin to dominate, and all eyes would then shift back to the crucial support level at $0.0303. This level has proven its strength in past dips, but it needs to hold firm to keep the bullish case intact.
💎If $0.0303 does hold, we could see a rebound that reignites buying pressure. However, if #IDEX breaks below this key support, it would invalidate the bullish setup, likely triggering a sharper decline toward the next major support at $0.0252. A further break below $0.0252 could mean an even more significant drop is in the cards, so caution is warranted.
Don’t let FOMO get the best of you; wait for clear confirmations before making your move.
MyCryptoParadise
iFeel the success🌴

Trading opportunity for IDEXUSDTBased on technical factors there is a Buy position in :
📊 IDEXUSDT
🔵 Buy Now
🪫Stop loss 0.03800
🔋Target 1 0.05500
🔋Target 2 0.07000
🔋Target 3 0.10000
💸RISK : 1%
We hope it is profitable for you ❤️
Please support our activity with your likes👍 and comments📝

IDEXUSDTIDEX ~ 1W
#IDEX If you have Conviction on this Coin,. Maybe you need to pay attention to this support block. at least 20%+ for the short term.

#IDEX rejecting from the diagonal Trendline 4-Hour TF!#IDEX rejecting from the diagonal Trendline 4-Hour TF!
BMV:IDEX needs to clear the trendline to turn bullish. Wait for BO/retest to long it. The local resistance level is PWH $0.04548, and local support level is PWL $0.03899.

IDEXUSDTIDEX ~ 1W
#IDEX If you have Conviction on this Coin,. Maybe you need to pay attention to this support block. at least 20%+ for the short term.

idexusdt Everything is clear in the picture. Look at the previous analysis of my channel and make profit. Be successful and victorious.


Idex / Usdt BINANCE:IDEXUSDT
Currently, the price of the index is at 0.05372 and is holding within a resistance zone. If the price breaks above this resistance level, the next significant resistance would be at 0.06832. This implies that if the price surpasses 0.05372, it could potentially rise further, encountering the next resistance at 0.06832, where selling pressure might increase.
Conversely, if the price fails to hold above the 0.05372 level and starts to decline, the first key support level to watch is 0.04390. This support level indicates a price point where buying interest may emerge, potentially halting or slowing down the downward movement. If the price breaks below 0.04390, the next support zones to monitor are 0.03874 and 0.03333. These levels represent areas where the price could find additional buying interest, but if these are also breached, the price may continue to decline further.
Understanding these levels is crucial for making informed trading decisions. Resistance levels indicate potential areas where prices might face downward pressure, while support levels signify potential points where prices might stabilize or reverse direction.
Disclaimer : I Am Not Financial Adviser

IDEXUSDT(IDEX) Updated till 27-08-24IDEXUSDT(IDEX) Daily timeframe range. hey even on bleeding market its still retracing for now. which is a strong move. getting a valid close over 0.04800 open the level till 0.06704. if the retail interest keeps up it can push further. recent support at 0.03687.

IDEXUSDTAfter breaking the downward trend line, the price has formed a trading range. We can consider the first target as the ceiling of the trading range and the second target as double the trading range, both of which are specified in the chart.
Be successful and profitable.
