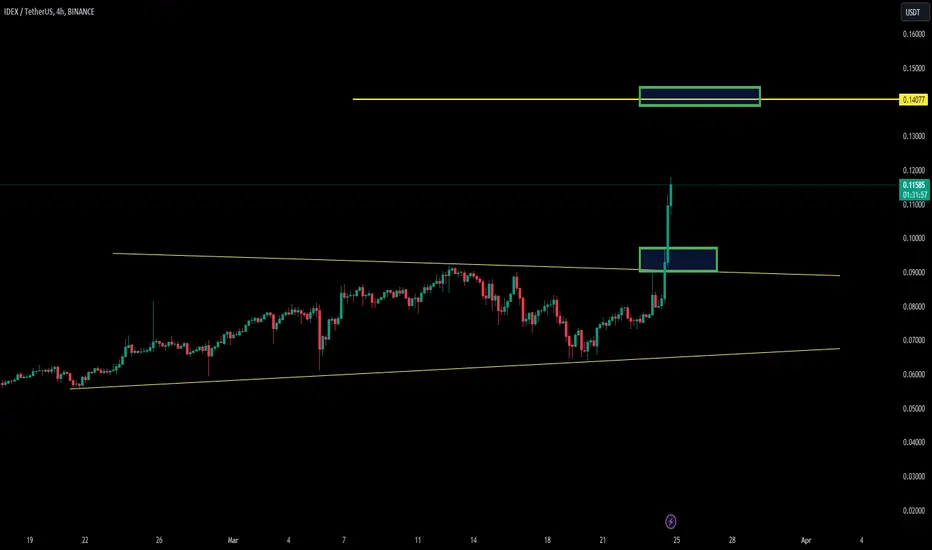
IDEXUSDT | Trade Analysis🚀 Time for another breakout trade with IDEXUSDT!
8-Hour Timeframe
We’ve seen a fantastic breakout of the previous high with significant volume on the 8-hour chart. Staying above the 50 EMA adds to the bullish sentiment.
Daily Timeframe
The daily chart isn't as strong, but we're still holding on to resistance from the previous day, showing potential for an upward move.
Weekly Timeframe
On the weekly chart, we closed above our S/R level and are trading above the 50 EMA—both bullish indicators.
Monthly and 3-Month Timeframes
The monthly candle closed with a top wick, but the 3-month candle looks much more promising, adding to the optimistic outlook.
Market Sentiment and Entry
The market sentiment is quite bullish right now. We’ve got an 8-hour engulfing candle as our entry signal, setting up a promising trade.
I'm bullish on this setup with a decent 1.5:1 risk-reward ratio. Let's see how this plays out!
IDEXUSDT trade ideas

#IDEX breaks the Diagonal Trendline and retests it in 1-Hour TF!#IDEX breaks the Diagonal Trendline and retests it in 1-Hour TF!
NASDAQ:IDEX local resistance level is PDH $0.0596, and local support level is PWL $0.0565. In case of a successful retest, it will pump hard.

Alikze »» IDEX | Pullback to broken structureIn the analysis presented in the previous post, it continued to grow in the 4H period after exiting the descending channel to the supply zone.
🔰 But in the weekly time, after a complex combination correction, it made a floor in the range of 0.34 and now, as can be seen, it has come out of the density and is currently facing selling pressure in the supply area, which can return in the range of the green box again. To continue the path, meet the demand.
🔰 Based on the structure, the current wave can be a motivational wave 3 or rising C, which will have the ability to touch the specified areas.
⚠️ In addition, if it penetrates and stabilizes under the green box, this scenario will be invalid.
»»»«««»»»«««»»»«««
Please support this idea with a LIKE and COMMENT if you find it useful and Click "Follow" on our profile if you'd like these trade ideas delivered straight to your email in the future.
Thanks for your continued support.
Sincerely.❤️
»»»«««»»»«««»»»«««

IDEX READY TO RESUME GROWTH?So today we should be looking at IDEX as after hitting a major resistance has been in correction mode since but it's becoming more likely it's getting ready for the next hike brace for the next move 500% is too easy buying now is like getting this gem at the floor, will not be going into lots of grammar always keeping it simple folks lemme know in the comments below what are your thoughts and any questions are welcome

IDEXUSDT(IDEX) Daily tf Range Updated till 25-03-24IDEXUSDT(IDEX) Daily timeframe range. another cool pump here, very close to break out of 0.11891 but looks like taking a retrace. maybe try again later. recent retrace point is at 0.09106. but if retail interest keeps up it may move further before going there.

IDEX looks bullishWe seem to be at the end of a large diametric F wave.
It is expected that the price will pull back towards the green range and by spending time, it will complete the G wave of this diametric and then we will see bullish movements up to the red box.
Closing a daily candle below the invalidation level will violate the analysis.
For risk management, please don't forget stop loss and capital management
Comment if you have any questions
Thank You

IDEX NEW INCREASE VOLUMEIDEX shows a new increase in volume, which could be confirmed in the coming time frames.
We will follow the coin to see if it's able to confirm.
The reason for the volume is the trend data that this coin shows.
This coin is a basic choice on daily trends.
Idex/usdt idea The price of Idex/USDT is currently attempting to break out of a price consolidation pattern on the weekly time-frame chart. It is common for price breakouts from such patterns to experience rapid and significant movements. I anticipate that Idex will surge in the coming days, potentially with a bullish move ranging between 100% to 200%.
It is essential to note that this is not financial advice. Please perform your own research (DYOR) before making any investment decisions.

✴️ Idex leaves No Room For Doubt, Will Grow 225%We have a combination of signals you most likely already know by memory, that is if you've been reading all the Altcoin charts we've been sharing.
Let's review those signals together as a learning exercise.
Repetition is the key to learning.
The pair is for Idex vs Tether US - IDEXUSDT
We have a low late December 2022.
This is a rounded bottom, marked here yellow with a cup pattern.
The ensuing action is quite standard across the Altcoins market.
✔️ IDEXUSDT produced a strong bullish wave early 2023 and then entered a long-term correction phase. This correction ended 18-August in a higher low compared to Dec. 2022.
After the mid-August low, trading volume can be seen rising as a new rounded bottom pattern forms.
✔️ Prices are now trading above EMA10 and EMA21 while battling EMA50.
Closing and staying above EMA50 confirms mid-term bullish potential, an easy target of 225%.
Additional support to the fact that the correction is over can be seen by looking at the volume, it is really low s prices go down, goes up as the higher low is hit.
All pretty standard.
➖ A low leads to a bullish wave.
➖ After the bullish wave we get a correction.
➖ After the correction another bullish wave...
Rinse and repeat until the market cycle is over.
Additional details on the chart.
Namaste.

IDEX trade ideaIDEX has seen a huge accumulation phase on weekly chart, and with the upcoming bull run its 54 mil $ market cap of now will look tiny in the future. on the 1 hour chart i see a nice uptrend and opportunity to set alert buy signal on Chandelier Exit indicator, i like it. First target would be around 0.115$, i will take back my investment there and just let it ride towards 1$

IDEX/USDT Facing on the key area. Could IDEX Break or rejected ?💎 IDEX has recently exhibited significant market dynamics. Presently, IDEX is encountering resistance in the supply area.
💎A successful breakout above this zone could lead to an easier breach of the resistance trendline, probability propelling the price toward our target area.
💎 However, if IDEX fails to break above the resistance and experiences rejection, there's potential for the price to retreat downwards, possibly towards the demand area.
💎 The demand area holds significant importance, as historically it has acted as a pivotal level for price action.
💎Bounces from this area have often signaled reversal opportunities. However, if IDEX breaks below the demand area, it could signify a bearish continuation, with the price likely heading toward key support levels or even lower.

IDEX primed for $1.43I’ll keep it short and sweet. I posted an idea on CKB/USDT. That position is up a very hefty lot.
Now I’m stacking positions on IDEX as well with a minimum target of $0.52 and a high target of $1.43
Currently sitting at a sub 100 mill. Market capitalization. This is primed for some very aggressive rallies towards our final targets

Alikze → #IDEX | Waiting for a pullback to the support zoneIn time H4, after the breakdown of the descending channel and the specified supply area that has become support, it can move to the green box area after the pullback to continue the path to the first supply area, which is at least 100% of the previous wave, and then to the area The next supply will continue its movement.
🟩Sup: 0.049
⛳️Tp 1:0.05188 ~ 0.05340
⛳️ Tp2 : 0.05757
-----------------
Please support this idea with a LIKE and COMMENT if you find it useful and Click "Follow" on our profile if you'd like these trade ideas delivered straight to your email in the future.
Thanks for your continued support.
Sincerely.❤️

#IDEXIt is moving in a medium-term ascending channel, which according to the corrective structure can continue after the pullback to the middle of the channel to the bottom of the 23% Fibo wave before the correction. If it can break 63 cents, it can continue its upward path, but considering the sharp and rapid fall structure, it is unlikely that it can continue its upward path in the short term.

LONG #IDEX#IDEX 173 days of accumulation. Only FWB:39M marketcap
Will definitely look interesting if we can breakout the box

IDEXUSDT Wait For The Discount Pricecurrently idex is at the price where retail traders will definently go for a trade bcz there just a breakout happened. But if you want a safe and very low risky trade with small stoploss then you can trade with my setup

IDEX analysis (4H)It seems like we have a big diametric that now the buyers are trying to complete the F wave of this diametric and raise the price.
By maintaining the flip line and the green range, the price can move towards the TPs.
I also specified the invalidation level. If a 4-hour candle closes below this level, the analysis will be violated
For risk management, please don't forget stop loss and capital management
When we reach the first target, save some profit and then change the stop to entry
Comment if you have any questions
Thank You

📊 IDEX USDT Analysis: Awaiting the Right Entry! 🕒📊 IDEX USDT Analysis: Awaiting the Right Entry! 🕒
IDEX USDT appears to be revisiting the crucial levels of $0.04916 and $0.04993. 📈
Keep a close eye on the 15-minute candle:
📈 If it closes above $0.04993, we might see bullish momentum.
📉 If it touches $0.04993 and heads south, the bearish trend may continue.
Patience is key here as we await the opportune entry point. Get ready to pounce when the time is right with this complimentary signal from Bitxer! 🐾💹

Idex 1d has unbelievable accumulation! Idex has unbelievable accumulation for 500 days in the same level
Now, both POCs are very close to the bottom which means they are are strong Vol, so make sure that you don't miss it out
The SL will be your choice but I highly recommend 1d below the red line!
All the best insha Allah!

IDEX/USDT Break Out Alert! Bullish Momentum for IDEXYello Paradisers, IDEX’s Potential Breakout
💎 IDEX has Break out from the descending channel pattern. For a confirmed and valid breakout, it’s pivotal to observe the daily close candle. If IDEX manages to hold above the support trendline at this point, it will signify a validated breakout.
💎 A look back at IDEX’s history reveals its sustained presence in a Strong Demand area. Observations show that IDEX has consistently formed wicks to capture an order block in the bullish OB, with the daily close persistently above the robust demand zone.
💎 IDEX has undergone numerous tests and attempts to shatter the descending channel, each time facing substantial rejections and subsequently falling back to the strong demand area. However, today marks a deviation, with IDEX successfully breaching the descending channel. The anticipation now is for IDEX to maintain its position above the pattern as the daily candle closes.
💎 The analysis would lose its validity if IDEX retreats from the Bullish OB area, as this could potentially signal a further downward trajectory for IDEX.

Is IDEX forming a triple bottom?
What is IDEX?
IDEX is a decentralized exchange with elements of centralized exchanges that make the network faster while maintaining its integrity as a decentralized environment. The platform is hosted on both Ethereum and Binance Smart Chain. Most similar projects use the automated market maker model to execute trades on a DEX, but IDEX has a different approach.
Chart pattern
It looks like a triple bottom/inverse head and shoulders.
my first target is $0.106 (+145%).
Good luck!

IDEX is Good IdeaHere is My Study on IDEX.
Welcome to my channel! Here you'll find daily technical analysis ofthe latest trends in the crypto market. From Bitcoin to altcoins, I'lIl be sharing my insights and predictions to help you make informed decisions
about your investments. Follow me for the latest updates and join the conversation in the comments!
Crypto technical analysis uses past price history to predict future price. It's not a guarantee and shouldn't be relied on solely for investment decisions. Consider other factors such as market trends, economic strength and
information dissemination. Use with caution.
This Is Not A Finacial Advise

IDEXUSDT Long/Short ( Just An Idea)After rechecking 200 sma at 4 hr IDEXUSDT just broke the resistance n checking the support, it may revisit 200 SMA for a recheck to confirm uptrend ...
Just watch the movement n take a good entry around here ...
NAFA n DYOR
ThankYou
