#ID TetherUS $ID Tether US IDUSTD #IDUSTD $IDUSTD #LONGGoing #Long on this pattern, based on the high time frequency and if you're time poor then suggest checking daily with a stop placed around 0.28.5 Some volume and interest, however if you know the fundamentals then please share. Chart looks good though. Hopefully, it kicks on.
IDUSDT trade ideas

ID- AT GOOD EPSpace ID keep trading within this range for weeks...2.9c - .3c
it hasn't made any reasonable yet...

ID analysis on 14/12/23 - BonbabycryptoWe see that the price tends to break the upper boundary
This is a personal opinion
not investment advice
For reference only

buy some idi have set the target price only by market cap
entry only 1-5 % from your total investing

id According to my personal opinion, we are now in an impulse wave of 3, with the first target being 0.5/6 and then $1.2.

Space id . Analyst professional Maybe it can grow up to two times, because in my opinion, there is a positive trend in the chart and there is a good support position, and in Rsi I also see positive divergence.

ID/USDT upward momentum? 👀 🚀ID Today Analysis💎Paradisers, direct your attention to #IDUSDT as it exhibits a compelling pattern. The asset is making an attempt to overcome a bearish Order Block, indicating a potential upward movement if it successfully breaks above.
💎#SPACEID has adhered to a descending channel pattern, breaking above it to embark on an upward journey. Currently, it's gaining momentum for another attempt to move past this bearish OB. If this breakout is maintained, it significantly increases the prospects for a bullish movement. With this ongoing upward momentum, AMEX:ID is targeting the resistance level at $.53282.
💎 For #ID, it’s crucial to be prepared for a potential bullish recovery from the support level of $0.22143. However, a descent below this level could indicate challenges in sustaining the bullish trend.
💎 In this fluid and constantly evolving market environment, strategic insight and informed decision-making are essential. Crafting a comprehensive trading strategy, inclusive of sound money management and a deep understanding of support and resistance dynamics, is crucial for achieving successful trading outcomes. 🌴💰

IDUSDT Long/ShortID never made a rally yet...
perfect place of Long is to but after breakout @ .3 area
expecting a minimum 70% up to .55 area...
if @ spot u can bag ID now....
SL around .25 area....
ThankYou n DYOR n NAFA.

ID on fly7-star has just received by print for ID. as you know the first 30% was spiked in just 1 min. There is no way to catch these type of unusual spikes and 7-star doesn't do that.
Stop loss will be just below this entry candle and first target will be the high of the previous candle. Nothing to lose DYOR.

IDUSDT"As we enter the bullish season, the initial target to aim for is
target : 5.0 🎯.
This is based on a combination of technical analysis indicators and market trends.
However, it's important to approach trading with caution and adapt to changing market
conditions.
Keep an eye on key support and resistance levels, as well as any significant news or events that may impact the market.
Remember to use proper risk management techniques and consider setting profit targets along the way.
Happy trading!"

ID Lights the Path: Get In on the Buy Action Today!"**Short Fundamental Analysis of ID Coin**
ID coin, the native token of the SPACE ID platform, is a utility token that powers the decentralized identity ecosystem. It is used for governance, staking, and incentivizing contributions to the network.
* **Total Supply:** 2,000,000,000 ID
* **Circulating Supply:** 430,506,132 ID
* **Market Cap:** $110,103,982 USD
* **24-Hour Trading Volume:** $14,389,734 USD
* **Current Price:** $0.255755 USD
ID coin has been on an upward trend in recent months, with its price increasing by over 100% since August 2023. This is likely due to the growing popularity of decentralized identity solutions and the increasing demand for tokens that can be used to govern and incentivize contributions to these networks.
**Recent News for ID Coin**
* **October 4, 2023:** SPACE ID announces integration with Chainlink to enhance oracles for decentralized identity applications.
* **September 28, 2023:** SPACE ID partners with Ankr to provide decentralized infrastructure for web3 applications.
* **September 20, 2023:** SPACE ID launches ID Verify, a new tool for verifying the authenticity of digital identities.
**Disclaimer**
This is not financial advice. Please do your own research before investing in ID coin.

SPACE ID will follow YFI!Space id is on the brink of a big breakout.
Consolidating against the last dropoffpoint. breakout will lead to expansion
Marketstructure break = done
Consolidating sideways = happening
Next breakout?

Long trade setup for IDUSDTFor the BINANCE:IDUSDT.P BINANCE:RSRUSDT.P Long Trade Setup, the following values are suitable for our interval trade:
Entry: 0.2368
Target: 0.2612
Stop: 0.2285
Cost Reduction: -
The profit is reasonable relative to the risk.

UPTADE: Long trade setup for IDUSDT🚀 #IDUSDT Update: We initially predicted it would take 20-24 hours to achieve this gain, but the results came in much faster than expected. A handsome 6.14% profit - just the right fit for our pockets! We're closing the trade and recommend you do the same. Strike fast, earn big with us! 💸
*Capital at risk.

IDUSDT 2DWith every touch, resistance zone will be weaker. #ID is fixed above ichimoku cloud, so I'm expecting breakout soon. Target would be around $0.43 ~ $0.45

ID 3d has a handle and cupID now looks solid but need to close at least 1 day above the yellow line for the handle and cup
Also, it just breakout the low volume support so I believe it will do well in the next few days hopefully
All the best insha Allah!

IDEURID has found support 3 times on a level. It seems like the level is going to hold and the ongoing uptrend is going to continue

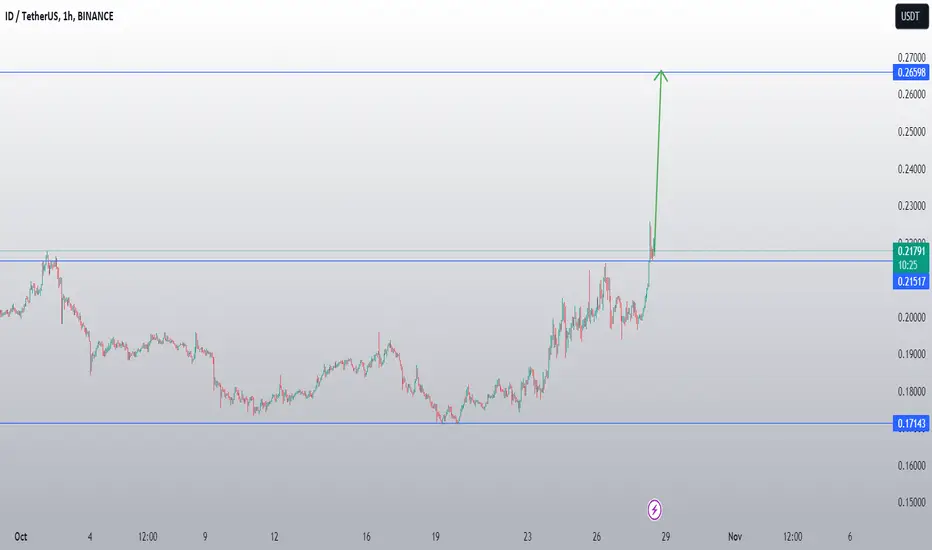
ID/USDT In the Key area level. Break the resistance or Rejected 💎 ID has indeed emerged as a standout in the market, showcasing a robust rally from $0.172 and skillfully navigating a breakout from the descending channel pattern. The chart underscores a valid retesting phase, suggesting that ID is poised to sustain its upward momentum. However, a significant hurdle remains, as ID grapples with a formidable resistance area—a historical point of retreat. Overcoming this barrier is essential for continuing its bullish journey.
💎 Should ID falter at this juncture and fail to conquer the resistance, it might retreat to the safety of the demand area, gathering strength for another attempt at ascent. Conversely, a successful breach of the resistance zone, probability could set the stage for a smooth sail towards the next station, notably the supply area.
💎 Yet, the market is fickle, and a less optimistic scenario exists. If ID retraces its steps to the demand zone and, crucially, fails to preserve its stance above this crucial support, it could unravel a bearish turn. This downturn would see ID seeking deeper solace, potentially at a lower support level.
💎 Here, it would need to muster significant rebound strength or risk a further descent to even more foundational support zones, highlighting the precarious balance between bullish aspirations and bearish realities.


IDUSDT.P Trade Plan Timeframe: 4H IDUSDT.P Trade Plan Timeframe: 4H
#Forex #IDUSDT.P #TechnicalAnalysis #CryptoSignal #TradingOpportunity #Divergence #TradingSignal #TradingwithBelieve
Hey traders! 👋 Let's dive into a potential trading opportunity on the IDUSDT.P pair using technical analysis. 📊
📉 Previously Bullish Trend:
Firstly, on the 4H- timeframe, we've been witnessing a Bullish trend in the IDUSDT.P pair. 🐻
🔄 Divergence on HH’s:
However, it's crucial to note that recently, we have started to observe a divergence pattern on the HH’s. This is an important signal that the Bullish momentum might be weakening. 📉🔄:
📊 Trade Opportunity:
Currently, we are looking at a potential trade opportunity with a Bearish bias.
📈 Entry Price: 0.2354
🎯 Stop Loss Level: 0.2400
🚀TP1: 0.2300
🚀TP2: 0.2245
💰 Investment Advice:
Please remember that trading carries risks, and it's essential to have a well-defined trading plan, proper risk management, and stop-loss orders in place. This analysis is for educational and informational purposes only and should not be considered as financial advice. Make sure to do your research and consider your risk tolerance before entering any trade.
Happy trading, and may the pips be in your favour! 🚀📈💰 #HappyTrading #ProfitOpportunity #TradeSmart #CryptoSignal #StockSignal #TradingwithBelieve

ID CONFIRMS NEW VOLUMEID seems to confirm the new volume.
Today and the coming days can be important.
ID/USDT - Space ID: BBand_Breakout◳◱ A Bollinger Band breakout has been identified on the AMEX:ID / CRYPTOCAP:USDT chart, as the price has breached the upper Bollinger Band. This occurrence suggests the emergence of a potential bullish trend. Noteworthy resistance levels can be observed at 0.1952 | 0.20804 | 0.23303, while significant support zones are located at 0.17021 | 0.15806 | 0.13307. It is advisable to contemplate initiating a buy position within the present price range of 0.21979 with the objective of attaining higher price levels.
◰◲ General info :
▣ Name: Space ID
▣ Rank: 284
▣ Exchanges: Binance, Kucoin, Bybit, Huobipro, Gateio, Mexc
▣ Category/Sector: N/A
▣ Overview: Space ID project overview is currently unavailable. I'll try to update this in the upcoming analysis.
◰◲ Technical Metrics :
▣ Mrkt Price: 0.21979 ₮
▣ 24HVol: 8,865,961.958 ₮
▣ 24H Chng: 10.204%
▣ 7-Days Chng: 22.54%
▣ 1-Month Chng: 11.16%
▣ 3-Months Chng: -12.35%
◲◰ Pivot Points - Levels :
◥ Resistance: 0.1952 | 0.20804 | 0.23303
◢ Support: 0.17021 | 0.15806 | 0.13307
◱◳ Indicators recommendation :
▣ Oscillators: SELL
▣ Moving Averages: STRONG_BUY
◰◲ Technical Indicators Summary : BUY
◲◰ Sharpe Ratios :
▣ Last 30D: -22.80
▣ Last 90D: -18.61
▣ Last 1-Y: -17.35
▣ Last 3-Y: -18.15
◲◰ Volatility :
▣ Last 30D: 0.38
▣ Last 90D: 0.55
▣ Last 1-Y: 0.85
▣ Last 3-Y: 1.28
◳◰ Market Sentiment Index :
▣ News sentiment score is N/A
▣ Twitter sentiment score is 0.74 - Bullish
▣ Reddit sentiment score is 0.52 - Bullish
▣ In-depth IDUSDT technical analysis on Tradingview TA page
▣ What do you think of this analysis? Share your insights and let's discuss in the comments below. Your like, follow and support would be greatly appreciated!
◲ Disclaimer
Please note that the information and publications provided are for informational purposes only and should not be construed as financial, investment, trading, or any other type of advice or recommendation. We encourage you to conduct your own research and consult with a qualified professional before making any financial decisions. The use of the information provided is solely at your own risk.
▣ Welcome to the home of charting big: TradingView
Benefit from a ton of financial analysis features, instruments and data. Have a look around, and if you do choose to go with an upgraded plan, you'll get up to $30.
Discover it here - affiliate link -
