BUY NOW - ASII is likely to be bullishPrice shows rejection in the support area and no Breakout has occurred
ENTRY BUY AT 4980
STOP LOSS AT 4840
TP 1 AT 5125
TP 2 AT 5275
ASII trade ideas

ASII Buy Trade Setup1. Trend Confirmation:
Identified a Change of Character by the break of the previous high at 4830, also the break of previous downtrend, indicating a reversal in market sentiment and a new bullish trend.
2. Fair Value Gap (FVG):
On the Weekly chart, identified Fair Value Gap between 4790 - 4940.
3. Trade Execution
Entry Price: 5100 ( Long Bullish Bar on 21 Oct 24)
SL: 4770 (FVG)
TP1: 5900
Risk-Reward Ratio (RRR): 1:2.4
Monitoring: Check-in daily closing price
4. Outcome:
Exit Price:
Profit/Loss: pips
-------------
Disclaimer
The analysis and content provided here are intended solely for personal journal and educational purposes. This information does not constitute financial advice, investment advice, or a recommendation to buy or sell any securities. Trading involves significant risk, and you should only trade with money you can afford to lose. Past performance is not indicative of future results. Always conduct your own research and consult with a qualified financial advisor before making any investment decisions.

ASII potential forming Butterfly patternASII completes point C perfectly and if going forward price move higher from point C, we might have a valid Butterfly pattern here.

ASII time to buy at 5900?IDX:ASII time to buy at 5900?
there will be a decline in this chart which results in a decline due to following the demand chart pattern below again
I think the area for buy limits in the 5900 to 5325 area is a good timing area, good luck.


ASII MAJOR BULLISH OTW 8300 !!!TP 1 : > 7300
TP 2 : > 8300
SL : < 5900
Risk In Your Hand
Press Like & Follow if u like my content
--- Thank You ---

17th April 2022: Analisys ASII: @Short 17th April 2022: Analisys ASII: @Short
Disclaimer:
This information is for educational purposes and is not an investment recommendation or representative of professional expertise. This analysis used herein is for illustration purposes only. This personal opinion should not be considered specific investment advice. I am not responsible for any trades, and individuals are solely responsible for any live trades placed in their own personal accounts.
- - - - - - - - - - - - - - - - - - - - - - - - - - - - - - - -
In our learning, we have three rules analisys before take action
1. Price rebound from strong resistance 70xx
2. price above ema55, ema 144 & ema 377
3. Ganfan break on price 66xx
Summary:
short possition for now . So,we will follow orange line or continue white line, complete with set up trading
Buy if price rebound range 61xx
Take Profit 1 @ 64xx
Take Profit 2 @ 70xx
Cutloss @ -
good luck guys , and happy profit ^^see you for next update
Thanks for Mr. Rudolf M. Bakkara for the sharing this knowledge metod.
#keep learning bakkarianz metod

IDX: ASII UNTIL THE END OF APRIL 2022weak support at 6250
Medium resistance at 6500
I Prefer green trading plan
Disclaimer:
This information is for educational purposes and is not an investment recommendation or representative of professional expertise. This analysis used herein is for illustration purposes only. This personal opinion should not be considered specific investment advice. I am not responsible for any trades, and individuals are solely responsible for any live trades placed in their own personal accounts.

ASII: Wait until reach Support areaASII is in DOWNTREND. Let's wait until it reaches Support area (5000) and observe the price action.

IDX: ASII FOR NEXT WEEK 14-18 FEB 2022weak support at 5300
medium resistance at 5500
I Prefer Red trading plan
Disclaimer:
This information is for educational purposes and is not an investment recommendation or representative of professional expertise. This analysis used herein is for illustration purposes only. This personal opinion should not be considered specific investment advice. I am not responsible for any trades, and individuals are solely responsible for any live trades placed in their own personal accounts.

ASII: AUTOMOTIVE INDUSTRY BULLISH OUTLOOK AHEAD?Hello Stock Market Enthusiast! Help the Channel Growth by smashing the FOLLOW and LIKES Button, then Share your opinion on the Comment Section below :)
ASII has broken out of the falling Wedge Pattern. It brings a potential upside movement toward the target area. The targets area base on the potential multiple rejection area.
The roadmap will be invalid after exceeding the support/target level
*DISCLAIMER:
This isn't a recommendation to buy or sell Stock, only an Outlook from technical perspective.
*FOLLOW FOR MORE CONTENTS AND UPDATES*

-02 dec 2021 trading analysis ASII-02 dec 2021
trading analysis ASII
Disclaimer:
This information is for educational purposes and is not an investment recommendation or representative of professional expertise. This analysis used herein is for illustration purposes only. This personal opinion should not be considered specific investment advice. I am not responsible for any trades, and individuals are solely responsible for any live trades placed in their own personal accounts.
- - - - - - - - - - - - - - - - - - - - - - - - - - - - - - - - - - -
long possition for ASII tomorow, pontetialy to next strong resistance 61XX (TP1) and 63xx (TP2)
let's see
- - - - - - - - - - - - - - - - - - - - - - - - - - - - - - - - - - -
good luck, and happy profit
see you for next update
#keep learning bakkarianz metode

IDX : ASII short term trade ideaDISCLAIMER ON
This analysis is not financial advice. Please note that you are responsible for your own investments. This chart only represents my opinion and view about the stock market in general and may be used only for educational purposes.

I hoped, it's gonna be happened as us excpected there's reasoning, why should I buy this stock because
1. Stochastic demonstrate golden cross
2. There's hammer bullish
3. this is area support
there are my opinion what did you think ?
be carefull
be ware of your money management
don't be greedy !

ASII: INDICATION OF AUTOMOTIVE INDUSTRY RECOVERY AHEAD?Hello Enthusiast Stock Traders! Here's Medium-Term outlook for ASII, Please give us the thumbs up and support the channel by Smashing the FOLLOW button :)
ASII has broken out of the Descending Broadening Wedge Pattern Impulsively. The MACD already crossed above the zero level area, it signify the potential upside movement ahead.
The roadmap will be invalid after exceeding the support/target area.
DISCLAIMER:
This is only an outlook, not a recommedation to buy or sell the Stock.

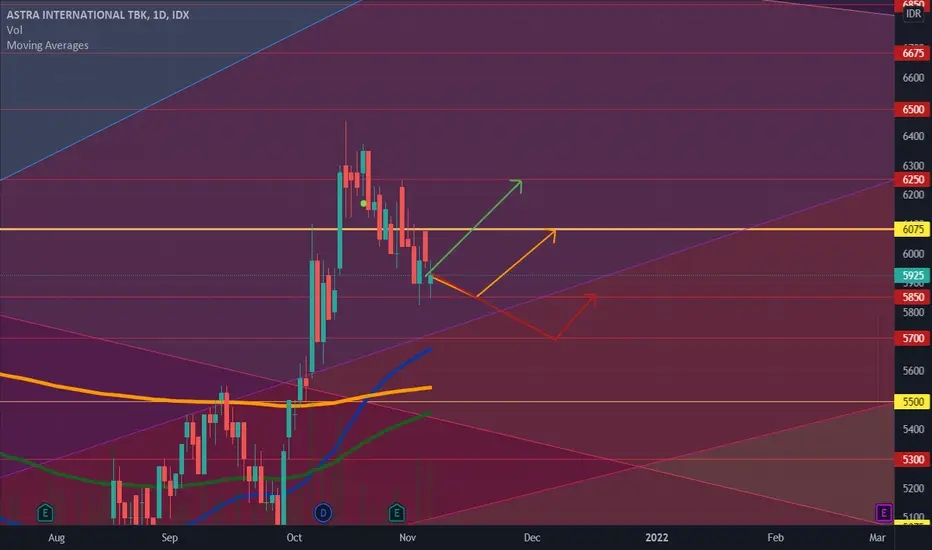
IDX: ASII FOR NEXT WEEK 8-12 NOV 2021weak support at 5850
strong support at 6075
i prefer yellow trading plan
Disclaimer:
This information is for educational purposes and is not an investment recommendation or representative of professional expertise. This analysis used herein is for illustration purposes only. This personal opinion should not be considered specific investment advice. I am not responsible for any trades, and individuals are solely responsible for any live trades placed in their own personal accounts.
WHY I BOUGHT ASII RECENTLYASII
Well, this is my first time writing my opinion or just simply my analysis upon a stock that caught my eyes recently.
So, I guess my writing would be hard to understand or something, please be kind :)
ASTRA INTERNATIONAL TBK (ASII)
I was interested in this stock since 4th October 2021 when it broke the 5550 price mark. With that, I suppose the downtrend of this stock was already done and I saw that this stock will have a new strong uptrend, since IHSG (COMP) was starting to have a higher highs and broke all the supports it had.
When the index was in the strong bullish momentum, I checked most of Indonesian's blue-chip stocks, including ASII, and they also had a strong bullish chart.
Now, go back to ASII.
Initially I was hoping that ASII would be drawn back to 5550 price mark (that was my buying area (5300 - 5550) and I would buy it as soon as it has a reversal pattern (green doji, hammer, or anything u can name of a reversal candle pattern). But well the market said otherwise and long story short, it flew to 6450.
But on 22nd October I saw that this stock was having a retracement that will soon end, and I was hoping it would be drawn back to 5900 - 6100 price mark (that was my new buying area). SO IT WAS DRAWN BACK !!
on 28th October, like I said before, the GREEN DOJI appeared!
I had an entry plan for that, which was waiting the stock to break the DOJI HIGH (6175) and put the "buy limit" at 6100 (my buying area).
On the 29th October it really flew beyond the 6175 price mark, so I placed the buy limit at 6100, and I let the price do the magic (since I was having a holiday in Bali) so I couldnt actually watching the stock 24/7.
Long story short, I got the stock at 6025!!
Now it slowly regaining its power to get back on the UPTREND.
Well, that was my story on how and why I get into the ASII stock.
Im sorry for lacking experience of writing this kind of thing. I hope you understand.
Thank you for your time.
Just contact me if you need to ask some questions about this and that, I am willing to help you as best as I could.

ASIIStrong support at 6025
Medium resistance at 6600
Market close at 6225
Already break weak support when market close today
I prefer green trading plan buy at 6275-6300 when already have confirmation at market
Target at 6600
Disclaimer:
This is for educational purpose

IDX: ASII FOR NEXT WEEKSTRONG RESISTANCE AT 6075
WEAK SUPPORT AT 5700
I PREFER GREEN TRADING PLAN
Disclaimer:
This information is for educational purposes and is not an investment recommendation or representative of professional expertise. This analysis used herein is for illustration purposes only. This personal opinion should not be considered specific investment advice. I am not responsible for any trades, and individuals are solely responsible for any live trades placed in their own personal accounts.

IDX:ASII potentialUsing daily timeframe, an inverted head and shoulder pattern can be seen. Using a weekly timeframe, there is a potential of creating double bottom/cup and handle pattern. Key Resistance is at Rp.7,000. Prediction target using that pattern is around Rp.11,000.

ASII: SIGN OF RECOVERY ON AUTOMOTIVE INDUSTRY?Hello Traders, here's your free outlook for ASII. Don't forget to smash the LIKES, COMMENT, and FOLLOW button to support the channel.
ASII is breaking the classic resistance. The momentum indicator is pointing up in the neutral area, indicating potential upside movement to the target area.
The roadmap will be invalid after exceeding the support/target area.
DISCLAIMER:
This is only an outlook, not a recommendation to buy or sell the stock.
