Chart Weekly BBNITrying to map BBNI shares, the market I see in the weekly timeframe is bearish in structure, which suggests there could be a decline in the coming weeks, while this week the market is positive for buying up to the area of 5,000 - 5,375 IDR.
BBNI trade ideas
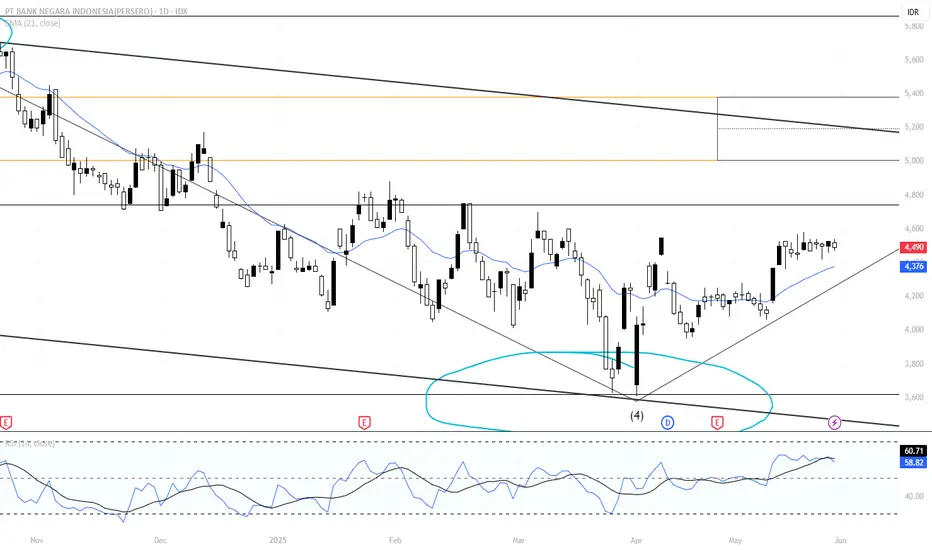
BBNI: A potential tripple bottom, with theoretical target 5,225
Price rebound after a retracement from strong resistance through 4,880-4,750-4,700.
If breaks above 4,700, pattern since Jan2025 may become triple bottom.
MACD and Stochastic shows a divergence on this pattern, gives indication a possible bullish in progress.
This pattern theoretical target price if confirmed is around 5,250.
Prepare your risk management if price breaks below 4,350.
M. Alfatih, CFTe, CTA, CTAD, CSA, CIB
Trade for Indonesian Stocks with:
Samuel Sekuritas Indonesia
Technical Trading Course -batch9: April 2025 (daftar di star.id/go/ttc2025)
M. A

BBNI Complex Correction?The banking rally at the start of December turns out to be a fakeout after all. Today BBNI gapped down and closed just 1 tick above today's low, with HEAVY volume. This shows that BBNI, and most probably other banking stocks haven't found their bottom yet.
If this scenario were to succed, then we will see a rally to welcome the dividend season.

Analysis: BBNI Sell OpportunityMarket Context:
- Price is within a bearish Discounted Weekly Fair Value Gap (FVG).
- Price broke Daily Trend Line.
Entry: 5450
Stop-Loss (SL): 5850 and trailing
Target Price (TP)2: 4300 (last swing low)
Target Price (TP)2: 3100 (1.618 Fibonacci extension & Weekly Bullish FVG)
Monitoring: Track the price daily and adjust based on new market information.
---------------------------------------------------------------------------------------------
Disclaimer
The analysis and content provided here are intended solely for personal journal and educational purposes. This information does not constitute financial advice, investment advice, or a recommendation to buy or sell any securities. Trading involves significant risk, and you should only trade with money you can afford to lose. Past performance is not indicative of future results. Always conduct your own research and consult with a qualified financial advisor before making any investment decisions.

Trading Plan for BBNI BearishMarket Context: Price is within a bearish Weekly Fair Value Gap (FVG) following a new swing low. Awaiting reversal confirmation during the current retracement. Monitor the MACD for Bearish Divergence signals.
Entry Strategy: Enter short when the trendline is broken.
Target and Stop-Loss:
Target Price (TP): 3050 (1.618 Fibonacci extension)
Stop-Loss (SL): 5850 (above FVG high)
Monitoring: Track the price daily and adjust based on new market information.
Documentation: Record trade details and observations for future analysis.

BBNI Potential reaching All Time High if break Cup&HandleBBNI is on track to reach all time high if able to complete the cup&handle pattern

BBNI still trying to breakout from the necklineBBNI pullback from neckline and now back on the neckline. Hopefully this time price will be able to breakout from the neckline and keep going up !!

Applying Technical Analysis in multiple time frames: $BBNI• Monthly
- Trend and momentum using Joe Rabil Method: Price is in presumptive uptrend (step 1 2 3 are complete).
- Elliot Wave Method: Mapping 12-(345)
- Harmonic Trading Method: Mapping: Bearish Bat (not drawn)
• Weekly
- Trend and momentum using Joe Rabil Method:
a. Price has been in an uptrend since Mar ’20.
Price continues making HH & HL and is above 18-week MA and 40-week MA; 18-week MA is rising and above 40-week MA.
b. MACD is rising as per price.
- Elliot Wave Method: Mapping 1234-(5)
- Harmonic Trading Method: Bearish Bat was achieved; next mapping is Bearish Crab (3.618BC is achieved)
• Daily
- Trend and momentum using Joe Rabil Method: Uptrend and in pullback. MACD DC
- Elliot Wave Method: None
- Harmonic Trading Method: None
• 1H
- Trend and momentum using Joe Rabil Method: Price is in transition phase.
This analysis is made to track my TA's learning progress, note: HTF is in uptrend but daily TF shows slowing momentum – monitor improvement in 1H TF.

BBNI (VCP - 12W 12/2 3T)I bought my positions today
January 4, 2024
Reasons:
1. Low-risk entry point
2. Confirmed stage 2 uptrend
3. Has gone through a majority line of supply
4. A breakaway move, the first breakout after the stock in a confirmed stage 2 uptrend
5. High relative strength
6. Volume dries up as less supply coming to the market
7. Huge volume on the breakout
Flaws:
1. The market is still in a hard-penny environment with only 32% of total stocks above the 200-day MA
2. The index is moving higher but there are still less stocks setting up.
This is a textbook VCP setup breaking out. I like to see some follow through action from now.

BBNIShowing a small double top pattern with possibility break down to 8800 if the neckline is penetrated on 9025

Head and Shoulders Bottom Chart Pattern BBNIHead and Shoulders Bottom Chart Pattern BBNI.
BBNI confirm chart pattern head n shoulder bottom. dan akan melanjutkan uptrend.
Target sesuai pada analisis chart diatas.

BBNITechnical Analysis is the forecasting of future financial price movements based on an examination of past price movements. Like weather forecasting, technical analysis does not result in absolute predictions about the future.

GAP in $BBNIThere is 2 GAP in $BBNI, first GAP already closed but the second GAP still open and good chance to take

BBNI - Buy On WeaknessBBNI Buy on Weakness at or better 8.225, take profit R1 9.200.
After the long Eid holiday in Indonesia, the IHSG was corrected in 4 days by 8.7%.
BBNI chart is relatively the same as the slow stochastic condition with the JCI, which is in an oversold position (yellow circle), which means that for now BBNI is in a buy on weakness condition.

BBNI - CUP WITH HANDLEBase reset, I re-enter my position after being shaken out on 25th Jan.
The stock broke out today on huge vol, but squatted. I'm very aggressive now, I like to see some good actions.

IDX: BBNI FOR NEXT WEEK 20-25 FEB 2022weak support at 7950
Medium resistance at 8275
I Prefer green trading plan
Disclaimer:
This information is for educational purposes and is not an investment recommendation or representative of professional expertise. This analysis used herein is for illustration purposes only. This personal opinion should not be considered specific investment advice. I am not responsible for any trades, and individuals are solely responsible for any live trades placed in their own personal accounts.
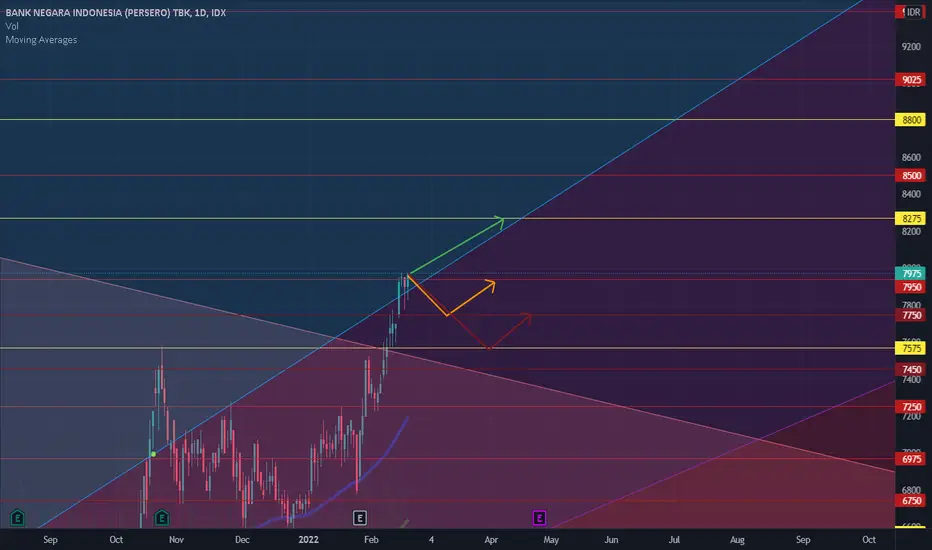
IDX: BBNI FOR NEXT WEEK 14-18 FEB 2022medium support at 7575
medium resistance at 7750
I Prefer green trading plan
Disclaimer:
This information is for educational purposes and is not an investment recommendation or representative of professional expertise. This analysis used herein is for illustration purposes only. This personal opinion should not be considered specific investment advice. I am not responsible for any trades, and individuals are solely responsible for any live trades placed in their own personal accounts.


BBNI - LOW CHEATI had my starting position at the low cheat level on 17th January 2022.
This is a textbook low cheat setup, I like to see if it can hold up and move in a long direction.

BBNI: BRIGHT FUTURE OUTLOOK OF BANKING SECTORHello Stock Market Enthusiast! Here's Long-term outlook for BBNI, Support the Channel by smashing the FOLLOW and LIKES Button, then Share your opinion on the Comment Section below :)
*BBNI created a Falling wedge pattern on Daily Timeframe
*BBNI has broken out of the falling wedge which indicates a potential bullish movement ahead
*MACD indicator already crossed up above the zero level area, that signify the stronger bullish momentum may remains in the future.
The roadmap will be invalid after exceeding the support/target level
*DISCLAIMER:
This isn't a recommendation to buy or sell forex pairs,only an Outlook from technical perspective.

IDX: BBNI FOR NEXT WEEK 10-14 JAN 2022weak support at 6975
weak resistance at 7250
I Prefer green trading plan
Disclaimer:
This information is for educational purposes and is not an investment recommendation or representative of professional expertise. This analysis used herein is for illustration purposes only. This personal opinion should not be considered specific investment advice. I am not responsible for any trades, and individuals are solely responsible for any live trades placed in their own personal accounts.

IDX: BBNI FOR NEXT WEEK 06-10 DEC 2021STRONG RESISTANCE AT 6575
WEAK RESISTANCE AT 6750
I PREFER RED TRADING PLAN
Disclaimer:
This information is for educational purposes and is not an investment recommendation or representative of professional expertise. This analysis used herein is for illustration purposes only. This personal opinion should not be considered specific investment advice. I am not responsible for any trades, and individuals are solely responsible for any live trades placed in their own personal accounts.

BBNI ( Bank Negara Indonesia )Falling channel
- Entry Point ( Garis Orange )
-Cut Losses ( Garis Merah )
-Take Profit ( Garis Hijau )
