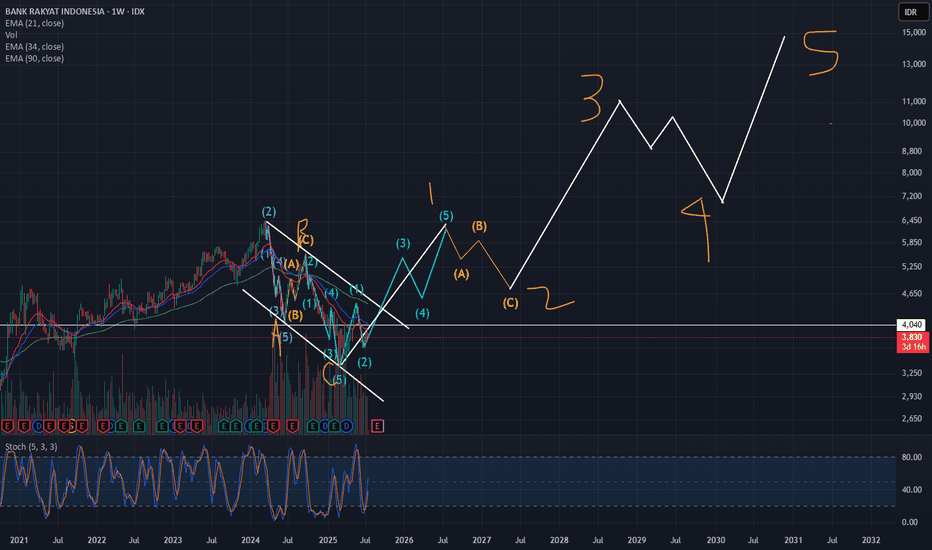
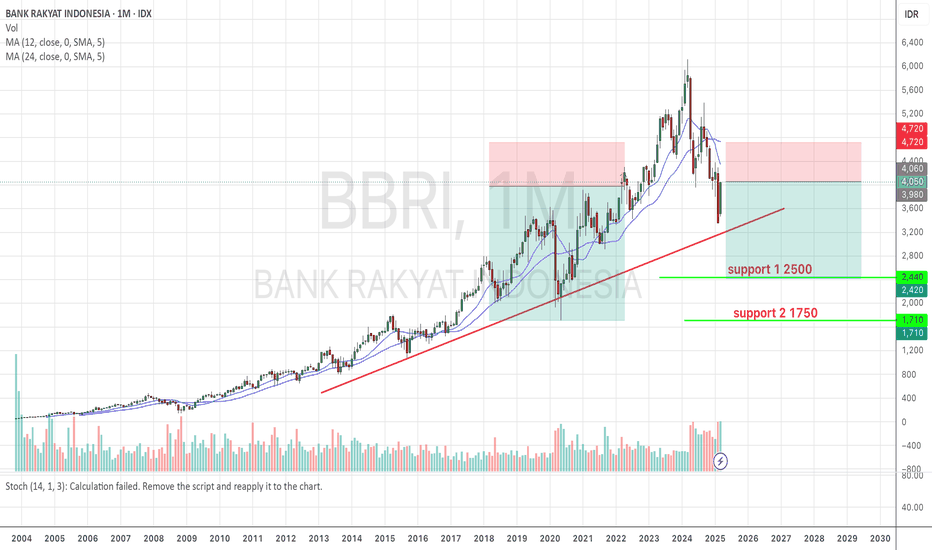
Needs ConfirmationJust to the point... The structure still looks bad but there is no invalid confirmation that it will continue to fall.
Weekly closed nya juga jelek
The action?
1. Speculation, buy now with averaging strategy There was demand in the previous candles. Invalid if the price drops below support
2. Waiting in the support area, in order to achieve a better RR ratio if the price drops until there.
3. Wait for the price to escape from dynamic resistance
DYOR
Trade with your own decision
BBRI trade ideas
BBRI hakaBBRI currently at Rp 3,630 closing price 9 April 2025.
Technical :
Near on support line at Rp 3,620. Still solid this line I think.
MACD give the good sign too
Macro :
Cum Date Dividend on 10 April 2025. Dividend Rp 208,4 (5.7% from the current price).
Trump delay the tariff in 90 days ahead. ( The news )
So, it's a good news for short term period.
It will be pump hard haha.
Thankyou for reading my ideas.
DWYOR.
I hope everyone have a good health and good life!
BBRI Weekly Outlook – Testing a Multi-Decade TrendlineTicker: BBRI (IDX)
Timeframe: Weekly
Status: High-Priority Technical Watchlist
🔹 Long-Term Structure
BBRI is currently testing a major ascending trendline that has been in play since 2008. This zone has historically served as a reliable long-term inflection point, having been tested multiple times over the past 15+ years.
The trendline has held six or more significant touchpoints, strengthening its technical validity.
Price action is also aligned with a horizontal demand zone (approx. 3,400–3,700), previously seen during the accumulation phases of 2019–2020.
📉 A Controlled Correction?
The recent correction has formed a descending channel structure, but:
The current drop is accompanied by high volume, which may indicate a capitulation or panic-driven sell-off.
Price behavior at this key junction will determine the next major phase: a base reversal or a structural breakdown into a broader downtrend.
🧠 Risk-Reward Outlook
If this long-term support holds:
A technical rebound toward the 4,800–6,500 zone remains well within reach.
The current setup presents a favorable risk-to-reward profile for medium-term positioning.
However, a weekly close below 3,200 would invalidate the bullish scenario, potentially triggering a decline to the 2,400–2,100 area — a demand zone from back in 2016.
📌 Strategic Takeaway
“BBRI is at one of the most critical technical inflection points of the past decade. This is more than just a trendline — it reflects long-term investor conviction versus macro pressure.”
Recommendation: Wait for confirmation from a reversal candle on the weekly timeframe. Patience is key — but this is not a zone to ignore.
BBRIBbri
Wait and see first
For long investors,bbri is still bullish but for trader or beginner investors,do not enter first
Because for the weekly the price has breaked thru MA200,we will monitor whether the support of 3.350 will break through or not i fit breaks through
We will monitor the price of 2.650-2.950
BBRI BUY NOW 3350! Support level at 3050-3150BBRI is now probably trade in the end of its deep correction, as on the technical view, by the Elliot Waves count, it is now completing the WAVE 5 of C (it confirmed by the Bullish Divergence on MACD).
The price could be be a little lower on the next 1-5 trading days to the 3050-3150, which is the 78.6% fibonacci retracement from broken uptrend. It is really strong support and i believe i would not be broken.
For about 6-12 months ahead, aim for minimum target of 30% return from this level.
Are you going with me???
CHEEERRRSSS...
BBRI Potential Drop to 3090 Before a ReboundI'm forecasting that BBRI may decline further to the 3090-2930 demand zone, where an unfilled order block exists. There's a potential bounce in the 3750-3690 area, but if selling pressure continues, the price could reach the lower support before reversing. Watching for confirmation at these key levels before taking action.
What do you think? let discuss below? 😊
Forecasting BBRI1. Key Support & Resistance Levels
Strong support: 3,620 – 3,500
Nearest resistance: 4,040 – 4,250
Major resistance: 4,800 – 5,025
Minor support: 3,810 (current price area)
2. Potential Price Movement
If the price holds at 3,810 and doesn’t break down to 3,620, there is a potential technical rebound toward 4,040 – 4,250.
If the price breaks down from 3,810 and breaches 3,620, there is a risk of further decline to 3,500 or even lower.
If the price rebounds from 3,810 and breaks through 4,040, there is potential for an upswing toward 4,250 – 4,510.
Entry Ideas & Reasons
📌 Buy Entry
Entry Level: 3,620 – 3,810 (strong support area)
Stop Loss: 3,500 (in case the price falls further)
Take Profit Target: 4,040 – 4,250 (nearest resistance)
Reason: The price is already at a historical support area. If there’s a bullish confirmation (reversal candle such as a hammer, doji, or bullish engulfing) in this zone, it can serve as a buy signal.
Analysis of BBRITechnical Analysis of BBRI
Price Level Analysis
Strong Support 3,800 - 3,900
Short-Term Resistance 4,100 - 4,300
Long-Term Resistance 4,600 - 4,800
Cut Loss Level 3,700 (if a deeper breakdown occurs)
📉 Current Situation: The price is approaching strong support at 3,900.
If a rebound occurs, the first target is 4,100 - 4,300.
If 4,300 resistance breaks, the price may rise to 4,600 - 4,800.
If it drops below 3,800, there is a risk of further decline.
❌ BBRI Risks
🔸 Economic Pressure & Inflation
If the economy slows down, non-performing loans (NPLs) could rise, affecting BBRI's profits.
Risks from MSMEs, which are more vulnerable to economic downturns.
High-interest rates could hamper credit growth.
🔸 High Interest Rates Policy
Bank Indonesia maintains high interest rates to control inflation, which could slow down new credit growth.
🔸 Competition from Fintech & Digital Banking
BBRI faces competition from digital banks like Bank Jago (ARTO), Bank Neo (BBYB), and others that are aggressively expanding digital services.
On the way to Devidend MomentumThe historical track record indicates that the final dividend share for BBRI typically occurs in March. This presents an opportunity to strategically position our portfolio. We can either aim to capture the dividend payout or capitalize on the potential price pullback that often follows the dividend distribution (At ex-date candle gap). To maximize our entry point, we can wait for BBRI to reach its nearest weekly support level, as it is currently trading close to it and being strong support. This approach allows us to potentially acquire shares at a discounted price, especially considering the current downtrend.
BBRI Eyes Key Resistance Levels After Breaking DowntrendIn the daily timeframe chart of Bank Rakyat Indonesia (BBRI), it is evident that the price has successfully broken out of the descending channel that previously restricted its movement. After breaking the resistance at 4,100, the price shows potential for further strengthening, with the next target at the 4,510 resistance level. If the bullish momentum continues, the subsequent target lies at the 4,800 resistance level. The 200 SMA at 4,898 is still above the current price, indicating a long-term bearish trend. However, the recent price movement suggests the potential for a short-term trend reversal toward an upward trend. The key support level currently stands at 4,100, serving as a critical area to maintain the bullish sentiment.


