BMRI IDEA PLANDO YOUR OWN RESEARCH!
BMRI will looking for near bottom price which is make a refersal pattern. Still wait the bottom and Buy More and HOLD HOLD!
BMRI trade ideas

BMRI i think BMRI still on correction area, might go to 6000 - 6200 for this or next year and correction continue

BMRI Just Waiting HereBMRI create double top formation in big timeframe 4200 is reasonable if this stock will rebound, but this big cap need more accumulation phase from big player
3600 area is make sense if we can touch it, all in

Buy on Weakness BMRI, relatively close to the Bottom.
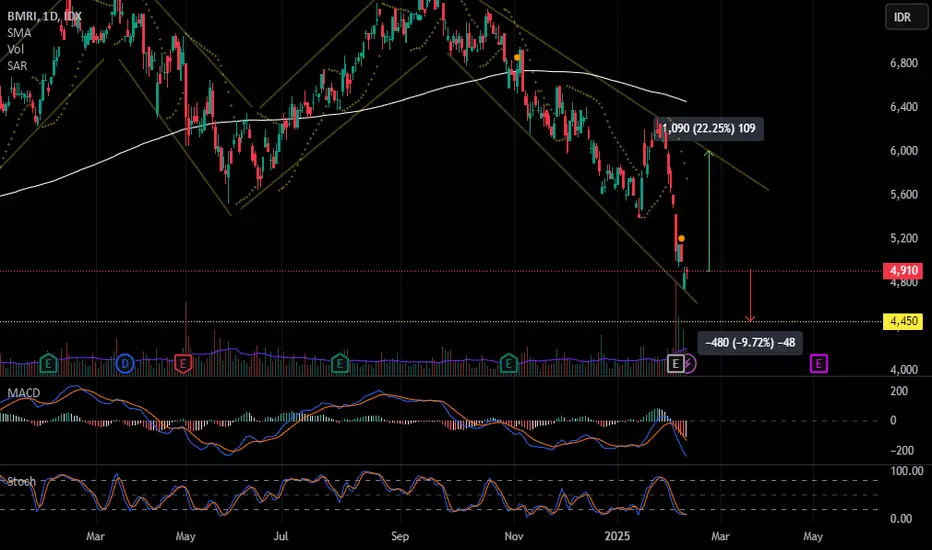
BMRI has been in a downtrend for 4 months, with the last breaking through the support level of 5400 (January 14, 2025).
cutloss level at support 4450 (-10%) and Target Price 6000 (upper trend line).
Risk and reward ratio 1 : 2.
Buy on Weakness BMRI 4910.
Prediction About Mandiri Bank BMRIBank Mandiri IDX:BMRI is currently trading at 5,050, showing signs of weakness as it struggles to hold key support levels. If the stock fails to maintain support, we could see further downside movement, potentially testing levels around 4,500. This scenario aligns with the broader market sentiment and recent technical patterns.
Investors should closely monitor price action near the support zone, as a decisive breakdown may trigger increased selling pressure. However, if BMRI manages to hold above support and gains bullish momentum, a rebound could be in play. Keep an eye on volume and market conditions for confirmation before making any trading decisions.

BMRI Rectangle RangeLegend stock BMRI ranging now in support in weekly timeframe
yes weekly this is good for swing trader
If 7500 breakout it will go to around 9000

BMRI (Weekly) Potential forming DOUBLE TOPBMRI on weekly Chart seems forming Double Top pattern. But still safe as long as the price not break the bottom support at 5500 - 5550.
in my opinion as long as the price not going under 5500,we still can hold the position.
DISCLAIMER ON

BMRI - CUP WITH HANDLEI bought the stock today
September 11, 2024
Reasons:
1. Low-risk entry point
2. Long base cup development
3. Formed a classic cup with a nice drifting handle
4. VCP characteristics on the handle
5. One of the leaders in banking sector beside IDX:BRIS
6. We're in a general market bull campaign
7. More stocks start showing traction.
Flaws:
1. Currently outperformed by the market
2. No big volume on the breakout
I like to see if it can holds up and continue moving higher from here.

BMRI on the way for bigger cup and handle targetBMRI already reached smaller cup and handle target, on the way for bigger cup and handle target.
congrats for those who follows this idea

$BMRI - Is Bearish Coming?IDX:BMRI is developing a huge Falling Wedges (Weekly Chart).
The Uptrend Line has been tested a few times and finally broke down on early May.
The target from the Falling Wedges pattern is around 3700-3800, is it too far? We might think so.
Here it is some of the interesting point to watch:
1) Current support area between 6150 - 6225
2) EMA233 Support around 4625 - 4650, it is aligned with current flat Leading Span B
3) Weekly RSI has been showing a bearish divergence, indicating a slowing upside movement, better watchout!

BMRI 3 Apr 24Buy 6650 ~ 6550
Price closed under 6450 = CL 6600
T1 7125
T2 7400
T3 Bullish trend, possible new HH (last low 6225 by Fib W1)

BMRI: Hidden Bullish Divergence, New All-Time High Soon?Hello Fellow Stock Traders, Here's a Technical Analysis of BMRI!
After successfully overcoming a significant resistance area, BMRI (Bank Mandiri) experienced a subsequent pullback, thereby establishing a new support level. Analyzing the trend perspective, it is observed that BMRI's price movement surged above the EMA 34 Line, which is a promising indicator of a bullish trend.
Additionally, the stock has formed a symmetrical triangle pattern, accompanied by an impulsive breakout represented by a bullish candlestick formation. Such patterns typically imply potential upward momentum and are considered positive signs for further price appreciation.
Furthermore, the MACD (Moving Average Convergence Divergence) indicator has displayed a hidden bullish divergence, indicating the possibility of the ongoing bullish trend extending further.
In summary, the technical analysis of BMRI reveals multiple favorable factors, including the breach of a substantial resistance area, a bullish trend indicated by the EMA 34 Line, a symmetrical triangle pattern breakout, and the hidden bullish divergence on the MACD. Traders and investors may interpret these signals as potential indications of an upward continuation in BMRI's price movements. As always, prudent risk management practices should be employed before making any investment decisions.
It is essential to note that the analysis will no longer hold validity once the target/support area is reached.
Please support the channel by engaging with the content, using the rocket button, and sharing your opinions in the comments below!
Disclaimer:
Please note that this analysis is solely for educational purposes and should not be considered as a recommendation to take a long or short position on IDX:BMRI .

BMRI - CUP WITH HANDLEI bought my positions today
January 4, 2024
Reasons:
1. Low-risk entry point
2. Confirmed stage 2 uptrend
3. Has gone through four majority line of supplies
4. Offers multiple entries at a cheat area and a handle
5. The base has VCP characteristics
6. High relative strength
6. Volume dries up as less supply coming to the market
7. Huge volume on the breakout
Flaws:
1. The market is still in a hard-penny environment with only 32% of total stocks above the 200-day MA
2. The index is moving higher but there are still less stocks setting up.
A classic cup and handle formation with cheat pivot entry. I like to see some follow through action from now.

BMRI potential reaching All Time High SoonBMRI is testing neckline at 6025 and failed to breakout.
However, I am very positive that BMRI will breakout 6025 and soon 6150 very soon to reach all time high.
As one of the 4 big banks in Indonesia, the strategy for BMRI is only buy buy and buy

BMRI on track to complete GartleyBMRI finally broke out from its sideways range and on track to complete the Gartley pattern.
BMRI is one of the 4 big banks in Indonesia and the strategy is only LONG !

BMRI AnalyseCurrently, the movement of Bank Mandiri (BMRI) shares is experiencing sideways and forming an Ascending Triangle Pattern in the range 5950-6100.
If BMRI manages to close above 6200 it will go to 6500-6600

BMRI reaching new ALL TIME HIGH today !!!Congrats for those who holding on Big Banks. BMRI going strong to All Time High today !!!

BMRI (VCP - 32W 19/3 4T)I bought my positions today
July 20, 2023
The reasons:
1. Low-risk pivot entry
2. A quintessential long-base VCP
3. The stock is at its all-time high with a six months base
4. It is in a confirmed stage 2 uptrend
5. It developed a crisp setup during the market correction
6. It has a high relative strength line
Flaw:
The general market is still declining
I'm expecting some positive actions in the upcoming days

BMRI - CUP AND HANDLEBMRI has made a cup and handle pattern and has breakout.
Potentially longterm BMRI will go to Rp12,100 (last target).
But before we see BMRI moving upward, we'll see a retest on the area Rp10,300-Rp10,350. And that's where I will be putting my trades on.
Take Profit target 1 is at Rp11,000 & don't forget to set breakeven.
Stop loss is area Rp10,150.
This is a 1:4 risk ratio trade.

BMRI - Awaiting for The Next Reversal PointA symmetrical triangle pattern appeared since Feb'20 to Jan'22, and create a foreseeable target price IDX:BMRI at 11,250. The price was hit 11,000 in Dec 6th, 2022, nearly hit 11,250 as a mirroring projection to the symmetrical triangle, and making a corrective wave so far.
I used Fibonacci Retracement to find its reversal point, and finally found it at 8,375 to 8,625 level, I would like to buy IDX:BMRI at these key level.
Wish me luck.

BMRI My Bullish ViewBMRI My Bullish View. Target 2 Cup and Handle. Target 1 Supply Zone. Strong Resistance.

BMRI - CUP WITH HANDLEI got my position today, the stock broke out on huge volume.
I like to see if it can hold up and follow-throughs for the next upcoming days.

IDX: BMRI FOR NEXT WEEK 20-25 FEB 2022weak support at 7775
weak resistance at 8050
I Prefer green trading plan
Disclaimer:
This information is for educational purposes and is not an investment recommendation or representative of professional expertise. This analysis used herein is for illustration purposes only. This personal opinion should not be considered specific investment advice. I am not responsible for any trades, and individuals are solely responsible for any live trades placed in their own personal accounts.
