EXCL - IDX XL Axiata outlookEXCL has excellent fundamentals. From year to year the company grows and it is still possible to penetrate and develop services, for example the entry of XL Home to various regions in Indonesia. then also the issue of the LINK merger with XL Axiata and FREN, I think it will be a very good catalyst. where the company's expenses will be reduced and the combination of customers will generate profits for the company. Apart from that, EXCL leaders have carried out a lot of communication to collaborate with Elon Musk's Starlink.
reasonable price target in my opinion:
2024 = IDR 3240 per share
2025 = IDR 4600 per share
2026= IDR 5200-5800 per share
This is a golden opportunity for you to buy it.
To discuss with me further, please comment below.
EXCL trade ideas

EXCL - Seller Losing Speed, Potential UpsideSeller is losing speed, and there is horizontal strong support at current level

#kafein #EXCL triple BOTTOM#kafein #EXCL - triple bottom, currently holding out and bouncing off the support at 2550 (StopLoss if below), targeting a minor swing rebound to 2800 +4.8% and targeting a triple bottom (TP) at 3370 +26%

February 23, 2022: Analisys EXCL: @NetralFebruary 23, 2022: Analisys EXCL: @Netral
Disclaimer:
This information is for educational purposes and is not an investment recommendation or representative of professional expertise. This analysis used herein is for illustration purposes only. This personal opinion should not be considered specific investment advice. I am not responsible for any trades, and individuals are solely responsible for any live trades placed in their own personal accounts.
- - - - - - - - - - - - - - - - - - - - - - - - - - - - - - - -
In our learning, we have three rules analisys before take action
1. Support & Resistant : now price 28xx wait rebound from 27xx or 28xx
2. Ema 55, Ema 144, Ema 377 : price above three Ema 377
3. Ganfan : free
Summary: Short possition for now because success rebound from strong Resistant 44xx. So,we will follow Red line complete with set up trading
Buy if price range @ 27xx-28xx
Take Profit 1 @ 30xx
Take Profit 2 @ 32xx
Cutloss @ -
good luck guys , and happy profit ^^see you for next update
Thanks for Mr. Rudolf M. Bakkara for the sharing this knowledge metod.
#keep learning bakkarianz metod

EXCL: Potential Bull on Mobile Telecommunication Industry!Hello Enthusiast Stock Traders! Here's Long-Term outlook for EXCL, Please give us the thumbs up and support the channel by Smashing the FOLLOW button :)
EXCL has broken out of the bullish flag and retested the upper trendline. The MACD already crossed above the zero level area, it signify the potential upside movement ahead.
The roadmap will be invalid after exceeding the support/target area.
DISCLAIMER:
This is only an outlook, not a recommedation to buy or sell the Stock.

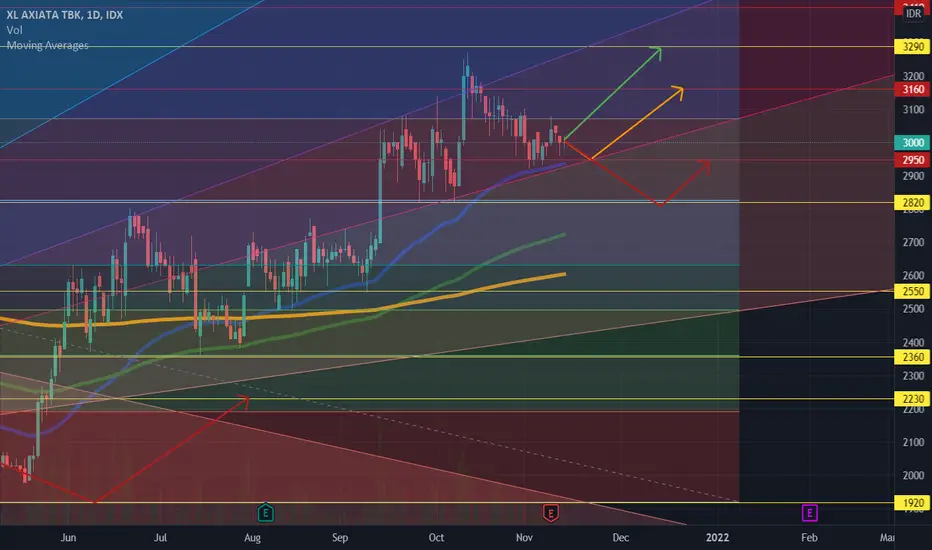
IDX: EXCL FOR NEXT WEEK 15-19 NOV 2021WEAK SUPPORT AT 2950
WEAK RESISTANCE AT 3160
I PREFER YELLOW TRADING PLAN
Disclaimer:
This information is for educational purposes and is not an investment recommendation or representative of professional expertise. This analysis used herein is for illustration purposes only. This personal opinion should not be considered specific investment advice. I am not responsible for any trades, and individuals are solely responsible for any live trades placed in their own personal accounts.
EXCLEXCLtest Analysis for trial new player
=========================================
=========================================

EXCLNB: DO MIND that These analyses I posted here are intended as my notes and not as investment recommendations or as financial advice! Please also note that you are always responsible for your own investments when trading on the stock exchange! The analyses are only based on my opinion and view. LETS CUANN!!!

Bullish Bias on EXCLEXCL seems to continue their rally after made a big consolidation as a bullish flag pattern appear. Buy on weakness should be your consideration with 3200 as it's objective target and 2150 as an invalidation

EXCL - Bullish Breakout or Bounce Back?Recently, EXCL breakout minor trendline with high volume and also golden cross ema 5 & 20.
If we take look on MACD , also there is golden cross signal.
Are those pattern and signal good enough to make EXCL breakout the major trendline to be bullish trend?
Comment your thought below.


Buy for Swing Trading EXCLThis Swing Trading analysis is for +-3 month ahead!!!
Enjoy it and Trade At Your Own Risk

EXCL: Siap siap untuk mantul...EXCL: Strong Bearish Ichimoku; Bearish Stochastic (%K = 28.14); Bullish MACD (MACD Level = -40.82);


Excl swing trading potentialExcl has a potential of swing trading with a 1:2 risk/reward ratio. It can also be seen that excl are trying to make a pattern which is double pattern. Excl in this week will try to test the resistance in 2270 where if it breaks out, there can be a potential of going to 2400 where the next resistance are. Buy at the range of 2190-2200. Cut loss when price is below 2120. Keep in mind, that excl needs to break out of its resistance which is 2270 in order to go to the next resistance which is 2400. Excl red volume is decreasing as well.Which means that the amount of retail/investor trying to sell the stock is decreasing. MACD bar chart are slowly progressing upward.
Disclaimer on

EXCL, Reguler Bullish divergence?well, it is still potential currently which means that there are two possibilities, either the divergence is working (time to go up) or the divergence will be broken (it means that the price still going down to form another divergence). TBH, it is still too early to conclude anything right now. However, what we can get from this is that the downtrend is getting weaker. so, why not putting EXCL as a watchlist for now and wait after we confirm wave 1-2 of Elliot wave first and if possible open a trade on wave 3 (if divergence is working).

EXCEL, HIDDEN BEARISH DIV?EFFECT 3-8 days possibly.
NB: DO MIND that These analyses i posted here are intended as my notes and not as investment recommendations or as financial advice! Please also note that you are always responsible for your own investments when trading on the stock exchange! The analyses are only based on my opinion and view. LETS CUANN!!!


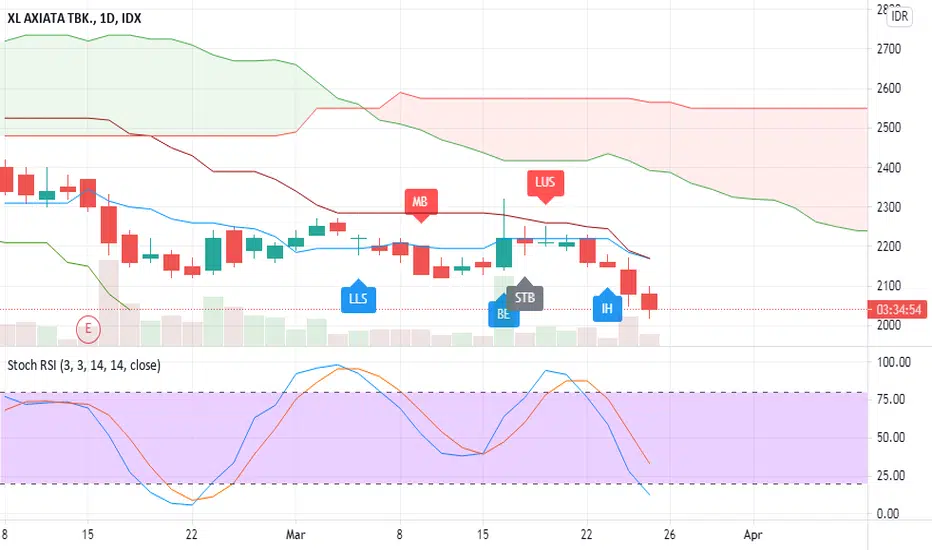
EXCL Bearish TrendlineAfter sideways trendline of EXCL as I predicted before (hanging on Fibo 23.6), it broke out the support with Three Black Soldiers and the continuation of bearish signal is happened. Also confirmed with Stochastic RSI.
There isn't any reversal signal, so if it can rebound on Fibo 50, we will see again whether EXCL can break resistance on 2590 or not. Any thoughts?
Summary:
Not a buying signal right now
TP1 2700
TP2 2820

$EXCL forms Pennant PatternPrice hits its middle Bolinger Bands, and also forms the continuantion bullish pattern, Pennant. Breakout @ 2880, maximum target @ 3220

EXCL masih sideways?Trend bearish ditandai dengan Hanging Man lalu dilanjutkan dengan 3 CS bearish. Pada closing hari Jumat, tidak berhasil menunjukkan adanya reversal pattern. Namun EXCL masih ada di support fibo 23.6, jadi apakah masih akan sideways beberapa hari?
NB: analisis murni dari teknikal sederhana, belum dari berita beredar
