Next report date
—
Report period
—
EPS estimate
—
Revenue estimate
—
200 IDR
5.82 T IDR
38.01 T IDR
5.92 B
About MEDCO ENERGI INTERNATIONAL
Sector
Industry
Website
Headquarters
Jakarta
Founded
1980
ISIN
ID1000053705
FIGI
BBG000BGQ654
PT Medco Energi Internasional Tbk engages in the exploration and production of oil and natural gas and other energy activities. It also involves onshore and offshore drilling activities, and investing in subsidiaries. It operates through the following segments: Exploration for and Production of Oil & Gas, Services, Power, Chemicals, Rental of properties, Trading and Holding & Related Operations. The company was founded on June 9, 1980 and is headquartered in Jakarta, Indonesia.
Related stocks
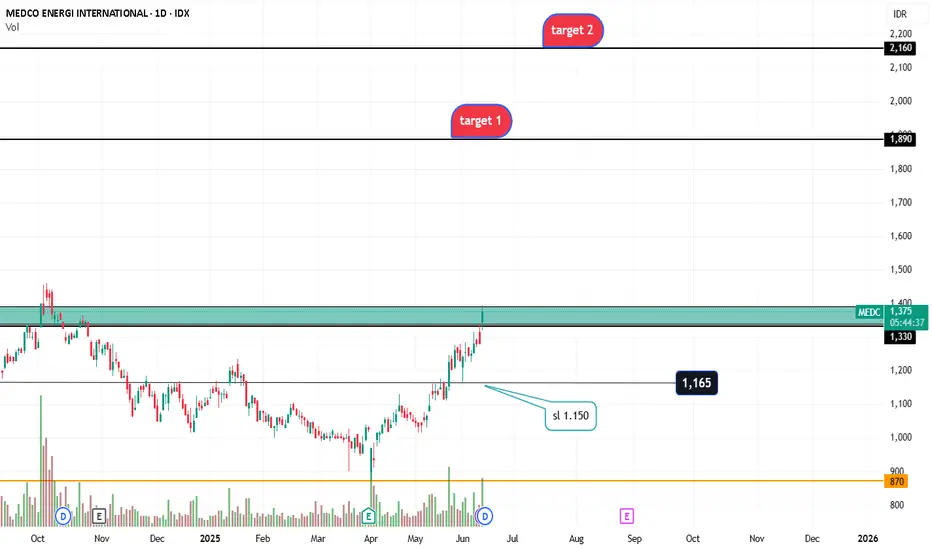
MEDC 14/05/25After a long weekend, there might be good news about the IHSG. While it has grown 18% over the past month, the oil sector in Indonesia still isn’t getting the love it deserves. With strong foreign accumulation, I believe IDX:MEDC might break through 1200. #FREEBANDZ

MEDC: Repeating Bullish Pattern, Upside Potential +16%?Hi Realistic Traders, let's delve into the technical analysis of IDX:MEDC !
The current market trend for the stock unmistakably showcases a bullish continuation pattern, marked by consistent upward movement above the EMA200 Line, signaling enduring momentum. At the same time, MEDC has formed a

MEDC got potential gap in 1405-1435for my friend he asked about this one
potential buy to 1405-1435 as long 1160 support strong


Potential Upside For MEDCIDX:MEDC
This stock has finally breakout from its demand zone (840 - 915). A chance to buy with potential target to 980 - 1100. But beware if price goes below 840.

MEDC - CUP WITH HANDLEI bought my positions today
January 19, 2023
The reasons:
1. Low-risk entry
2. Cup and handle pattern
3. High relative strength stock
4. Constructive basing period
5. Outstanding fundamental basis.
The flaw:
The general market is declining, the breakouts are prone to failure.


MEDC: Commodity Stocks Still Has a Chance to Create New High?Hello Fellow Stock Trader and Investor!
Price Action Analysis
MEDC has moved above the dynamic trendline and bullish trendline. The breakout of a falling wedge pattern indicates a possible upside movement ahead. Furthermore, the momentum indicator makes a golden cross, signifying a possible upsi

See all ideas
Summarizing what the indicators are suggesting.
Neutral
SellBuy
Strong sellStrong buy
Strong sellSellNeutralBuyStrong buy
Neutral
SellBuy
Strong sellStrong buy
Strong sellSellNeutralBuyStrong buy
Neutral
SellBuy
Strong sellStrong buy
Strong sellSellNeutralBuyStrong buy
An aggregate view of professional's ratings.
Neutral
SellBuy
Strong sellStrong buy
Strong sellSellNeutralBuyStrong buy
Neutral
SellBuy
Strong sellStrong buy
Strong sellSellNeutralBuyStrong buy
Neutral
SellBuy
Strong sellStrong buy
Strong sellSellNeutralBuyStrong buy
Displays a symbol's price movements over previous years to identify recurring trends.
MMTP5671855
Medco Maple Tree Pte. Ltd. 8.96% 27-APR-2029Yield to maturity
7.85%
Maturity date
Apr 27, 2029
MEOK4834844
Medco Oak Tree Pte Ltd. 7.375% 14-MAY-2026Yield to maturity
7.73%
Maturity date
May 14, 2026
MDLD5295811
Medco Laurel Tree Pte Ltd. 6.95% 12-NOV-2028Yield to maturity
7.04%
Maturity date
Nov 12, 2028
MDBL4938035
Medco Bell Pte. Ltd. 6.375% 30-JAN-2027Yield to maturity
6.34%
Maturity date
Jan 30, 2027
See all MEDC bonds
Frequently Asked Questions
The current price of MEDC is 1,320 IDR — it has increased by 0.79% in the past 24 hours. Watch MEDCO ENERGI INTERNATIONAL stock price performance more closely on the chart.
Depending on the exchange, the stock ticker may vary. For instance, on IDX exchange MEDCO ENERGI INTERNATIONAL stocks are traded under the ticker MEDC.
MEDC stock has fallen by −0.39% compared to the previous week, the month change is a 1.59% rise, over the last year there was no change in MEDCO ENERGI INTERNATIONAL price.
We've gathered analysts' opinions on MEDCO ENERGI INTERNATIONAL future price: according to them, MEDC price has a max estimate of 2,131.15 IDR and a min estimate of 1,264.61 IDR. Watch MEDC chart and read a more detailed MEDCO ENERGI INTERNATIONAL stock forecast: see what analysts think of MEDCO ENERGI INTERNATIONAL and suggest that you do with its stocks.
MEDC reached its all-time high on Sep 18, 2023 with the price of 1,705 IDR, and its all-time low was 130 IDR and was reached on Feb 12, 2016. View more price dynamics on MEDC chart.
See other stocks reaching their highest and lowest prices.
See other stocks reaching their highest and lowest prices.
MEDC stock is 4.72% volatile and has beta coefficient of 0.46. Track MEDCO ENERGI INTERNATIONAL stock price on the chart and check out the list of the most volatile stocks — is MEDCO ENERGI INTERNATIONAL there?
Today MEDCO ENERGI INTERNATIONAL has the market capitalization of 31.75 T, it has increased by 3.19% over the last week.
Yes, you can track MEDCO ENERGI INTERNATIONAL financials in yearly and quarterly reports right on TradingView.
MEDCO ENERGI INTERNATIONAL is going to release the next earnings report on Aug 27, 2025. Keep track of upcoming events with our Earnings Calendar.
MEDC net income for the last quarter is 288.09 B IDR, while the quarter before that showed 1.49 T IDR of net income which accounts for −80.62% change. Track more MEDCO ENERGI INTERNATIONAL financial stats to get the full picture.
MEDCO ENERGI INTERNATIONAL dividend yield was 3.70% in 2024, and payout ratio reached 17.54%. The year before the numbers were 3.84% and 22.03% correspondingly. See high-dividend stocks and find more opportunities for your portfolio.
As of Jul 29, 2025, the company has 3.33 K employees. See our rating of the largest employees — is MEDCO ENERGI INTERNATIONAL on this list?
EBITDA measures a company's operating performance, its growth signifies an improvement in the efficiency of a company. MEDCO ENERGI INTERNATIONAL EBITDA is 20.45 T IDR, and current EBITDA margin is 52.79%. See more stats in MEDCO ENERGI INTERNATIONAL financial statements.
Like other stocks, MEDC shares are traded on stock exchanges, e.g. Nasdaq, Nyse, Euronext, and the easiest way to buy them is through an online stock broker. To do this, you need to open an account and follow a broker's procedures, then start trading. You can trade MEDCO ENERGI INTERNATIONAL stock right from TradingView charts — choose your broker and connect to your account.
Investing in stocks requires a comprehensive research: you should carefully study all the available data, e.g. company's financials, related news, and its technical analysis. So MEDCO ENERGI INTERNATIONAL technincal analysis shows the strong buy rating today, and its 1 week rating is strong buy. Since market conditions are prone to changes, it's worth looking a bit further into the future — according to the 1 month rating MEDCO ENERGI INTERNATIONAL stock shows the strong buy signal. See more of MEDCO ENERGI INTERNATIONAL technicals for a more comprehensive analysis.
If you're still not sure, try looking for inspiration in our curated watchlists.
If you're still not sure, try looking for inspiration in our curated watchlists.