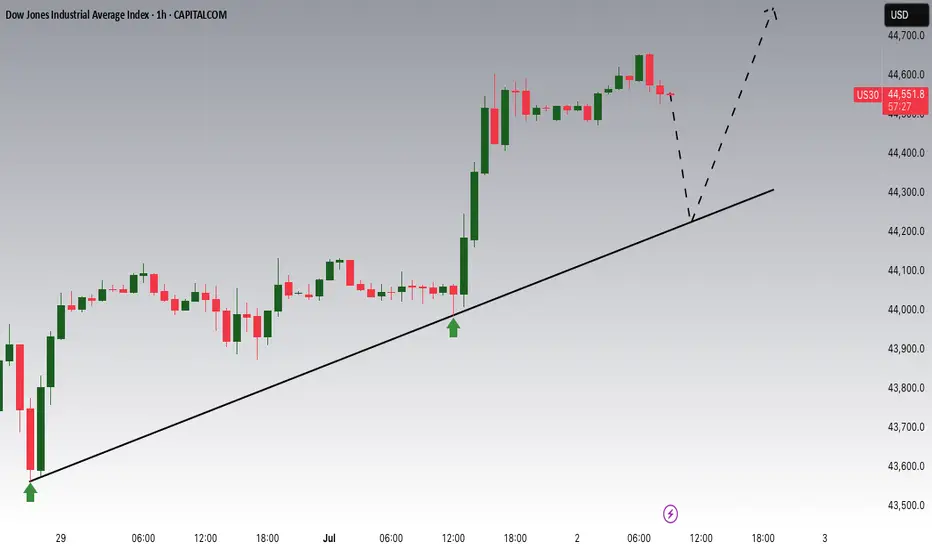
US30 Potential UpsidesHey Traders, in today's trading session we are monitoring US30 for a buying opportunity around 44,230 zone, Dow Jones is trading in an uptrend and currently is in a correction phase in which it is approaching the trend at 44,230 support and resistance area.
Trade safe, Joe.
DOW trade ideas
Dow Jones -> A breakout rally of +40%!🐂Dow Jones ( TVC:DJI ) will create new highs:
🔎Analysis summary:
Since the April lows, the Dow Jones already rallied about +25%. This was simply the expected rejection away from a strong confluence of support. Now, the Dow Jones is sitting at the previous all time highs and about to break out, leading to a massive rally.
📝Levels to watch:
$45.000, $60.000
🙏🏻#LONGTERMVISION
Philip - Swing Trader

PCEs & attacks on PowellWe are carefully monitoring the PCEs today, to see, "wins" this small battle in the rate-lowering war. Let's dig in.
Let us know what you think in the comments below.
Thank you.
77.3% of retail investor accounts lose money when trading CFDs with this provider. You should consider whether you understand how CFDs work and whether you can afford to take the high risk of losing your money. Past performance is not necessarily indicative of future results. The value of investments may fall as well as rise and the investor may not get back the amount initially invested. This content is not intended for nor applicable to residents of the UK. Cryptocurrency CFDs and spread bets are restricted in the UK for all retail clients.

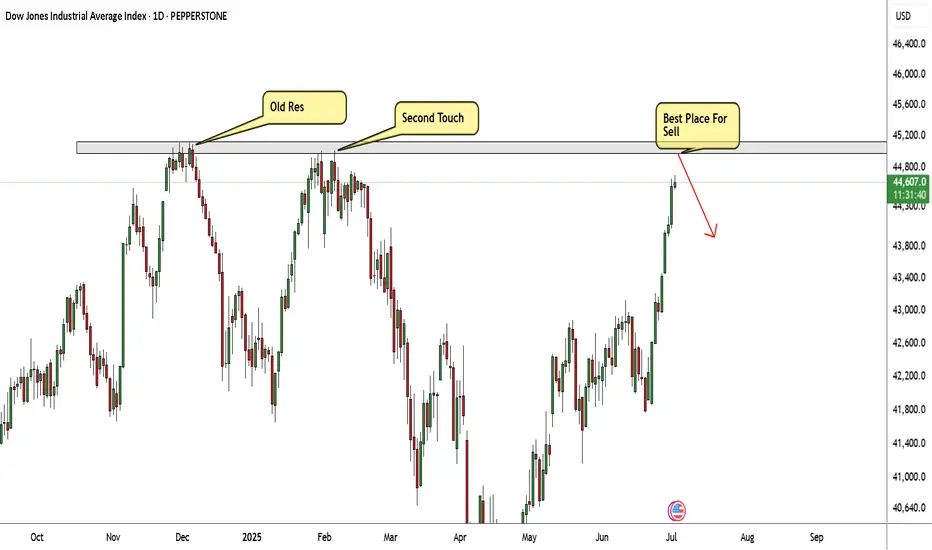
US30 Very Near Strong Res Area , Short Setup To Get 500 Pips !Here is my US30 Daily Chart , the price very near the highest price area , this res area forced the price to go down very hard 2 times so i think this time will be the biggest movement to downside , so i`m waiting the price to touch it and give me a good bearish price action and then we can enter a sell trade and targeting at least 500 pips . if we have a daily closure above then this idea will not be valid .
US30 Awaits NFP – Bullish Above 44,410, Volatility Expected US30 (Dow Jones) – NFP Volatility in Focus
Today’s session is expected to be volatile due to the upcoming NFP report. Based on current forecasts, the outlook remains broadly positive for U.S. indices, though intraday swings are likely.
Technical Outlook:
As long as the price holds above 44,410, the bullish momentum remains intact, with potential upside targets at 44,750 and 44,910
A pullback toward 44,410 remains possible before any continuation higher.
However, a confirmed 4H close below 44,400 would shift the short-term structure to bearish, opening the door toward the 1st support zone around 44,180.
Key Levels:
• Resistance: 44,750 / 44,910 / 45,090
• Support: 44,410 / 44,180 / 43,970
Stay cautious — volatility is expected to spike around the release of the jobs data.

US30: The bullish trend remains in progressUS30: The bullish trend remains in progress
On April 7, 2025, US30 hit its lowest point at approximately 36500. Since then, despite significant concerns regarding Trump's tariffs and the ongoing turmoil in the Middle East, all indices have been on the rise.
Overall the U.S. indicators are showing robust performance.
In a worst-case scenario, we might observe US30 to make a minor correction close to 42500 before it bounces further, potentially retesting the chart level that aligns with its all-time high price as well.
Key target levels: 44000 and 44970
You may find more details in the chart!
Thank you and Good Luck!
❤️PS: Please support with a like or comment if you find this analysis useful for your trading day❤️

US30: Will Go Up! Long!
My dear friends,
Today we will analyse US30 together☺️
The market is at an inflection zone and price has now reached an area around 44,585.50 where previous reversals or breakouts have occurred.And a price reaction that we are seeing on multiple timeframes here could signal the next move up so we can enter on confirmation, and target the next key level of 44,663.28.Stop-loss is recommended beyond the inflection zone.
❤️Sending you lots of Love and Hugs❤️

Us30 (buy)a perfectly formed head and shoulders, neckline broken,all indications shows us30 is on bull run to 45,00-46,00 wont be surprised if it makes a new ath
Wait for pullbacks and enjoy the run

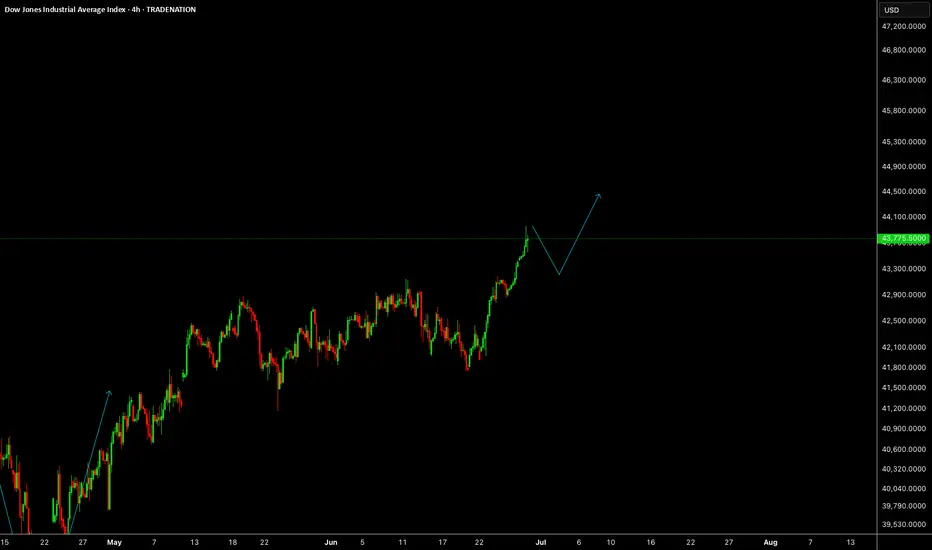
DOW JONES INDEX (US30): Consolidation is Over
Dow Jones Index completed a bullish accumulation on a daily.
The price violated a key horizontal resistance cluster and closed above that.
Next goal for bulls is 43790.
❤️Please, support my work with like, thank you!❤️
I am part of Trade Nation's Influencer program and receive a monthly fee for using their TradingView charts in my analysis.

DOW JONES: Final phase of bullish wave has started.Dow is practically overbought on its 1D technical outlook (RSI = 69.306, MACD = 518.450, ADX = 36.217) but that should little affect the heavily bullish price action on the long term. The reason is that after the April bounce on the 1W MA200, Dow entered the final phase of the Bull Cycle that started on the October 2022 bottom and according to all prior bullish waves inside the 16 year Channel Up, it should rise by a minimum of +71%. That gives a TP = 49,000.
## If you like our free content follow our profile to get more daily ideas. ##
## Comments and likes are greatly appreciated. ##

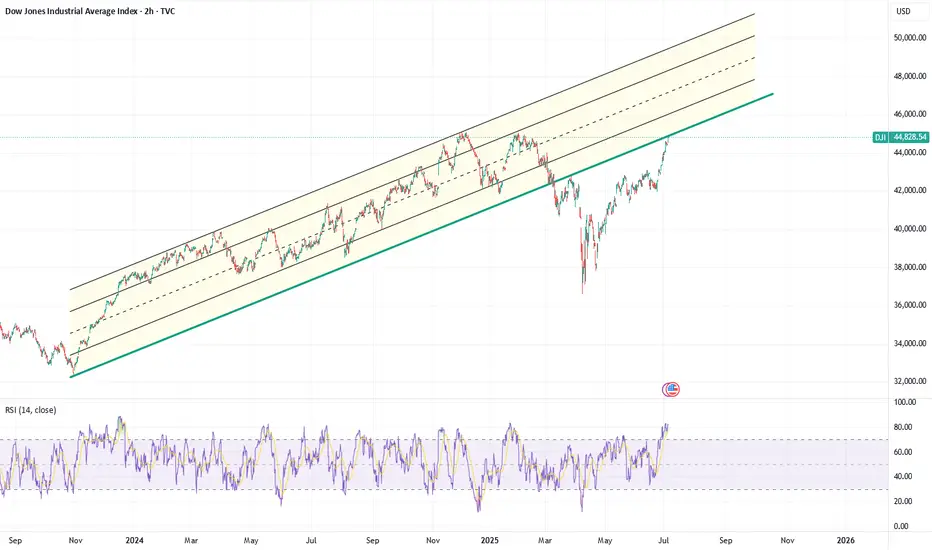
DOW JONES This is how it hits 50000 by the end of the year.Dow Jones (DJI) has been trading within a Channel Up pattern since the October 03 2022 market bottom and since the April 07 2025 Low, it's been unfolding the pattern's new Bullish Leg.
Ahead of an emerging 1D Golden Cross, the first since December 13 2022, the price action looks more bullish than ever strongly supported by the 1D MA50 (blue trend-line).
In fact, it is not that different from the fractal of that last 1D Golden Cross, which traded inside a neckline before the Bullish Leg broke upwards and completed eventually a +39.96% rise.
We expect a 50000 test towards the end of the year at the top of the Channel Up, which is still marginally below the tolerance levels of a +39.36% rise.
-------------------------------------------------------------------------------
** Please LIKE 👍, FOLLOW ✅, SHARE 🙌 and COMMENT ✍ if you enjoy this idea! Also share your ideas and charts in the comments section below! This is best way to keep it relevant, support us, keep the content here free and allow the idea to reach as many people as possible. **
-------------------------------------------------------------------------------
Disclosure: I am part of Trade Nation's Influencer program and receive a monthly fee for using their TradingView charts in my analysis.
💸💸💸💸💸💸
👇 👇 👇 👇 👇 👇

us30 analysis 25-06-2025There was engulfing in the 4 hour candle and the next candle was a shooting star. So there is a lot of liquidity in the previous engulfing. So the market can come to 22092 to grab this liquidity. However, to take an entry, you should take confirmation of lower time frames like 1 minute, 5 minutes.

SELL SIGNAL IS HEREUS30 initiates a trend line from 22nd June, 2025, on its 4hr chart, and current price action faces resistance, as such, leading to a temporary sell in a bullish trend. The most possible TP's for the sell signals are on the support lines that the trend line passes through.
tp 1- 43926.9
tp 2 - 43838.5
tp 3 - 43,561.7
Sl - 44200.
Risk wisely.......

Bullish momentum to extend?DJ30 is falling towards the support level which is a pullback support and could bounce from this level to our take profit.
Entry: 42,853.55
Why we like it:
There is a pullback support level.
Stop loss: 41,577.28
Why we like it:
There is a pullback support level.
Take profit: 45,132.60
Why we like it:
There is a pullback resistance that lines up with the 61.8% Fibonacci projection.
Enjoying your TradingView experience? Review us!
Please be advised that the information presented on TradingView is provided to Vantage (‘Vantage Global Limited’, ‘we’) by a third-party provider (‘Everest Fortune Group’). Please be reminded that you are solely responsible for the trading decisions on your account. There is a very high degree of risk involved in trading. Any information and/or content is intended entirely for research, educational and informational purposes only and does not constitute investment or consultation advice or investment strategy. The information is not tailored to the investment needs of any specific person and therefore does not involve a consideration of any of the investment objectives, financial situation or needs of any viewer that may receive it. Kindly also note that past performance is not a reliable indicator of future results. Actual results may differ materially from those anticipated in forward-looking or past performance statements. We assume no liability as to the accuracy or completeness of any of the information and/or content provided herein and the Company cannot be held responsible for any omission, mistake nor for any loss or damage including without limitation to any loss of profit which may arise from reliance on any information supplied by Everest Fortune Group.

Dow Reverses for Pullback, Bullish Case Valid Above 44,400US30 OVERVIEW
Dow Jones Maintains Uptrend, Poised for Retest and Potential Extension
Dow Jones futures edged up by 69 points early Wednesday, signaling cautious optimism as investors shifted focus away from technology stocks to kick off the second half of the year.
The price continued its bullish trend until it reached the resistance zone, then reversed for a correction, falling below 44,630. Remaining below this level could extend the correction toward 44,400, which now serves as key support and pivot line for confirming a bearish trend.
As long as the index trades above 44400, the bullish trend remains intact, targeting 44,630, and potentially crossing the resistance zone within 44760 and 44920.
Resistance Levels: 44,630 → 44760 → 44920.
Support Levels: 44400 → 44120 → 43960.
US30Market Drivers
Rotation: Investors are shifting from tech to industrials and other Dow components to start the second half of 2025.
Trade Policy: Optimism over potential US trade agreements and a 90-day delay in new tariffs has supported the rally.
Technical Outlook: The overall momentum is bullish and first resistance at 45.043

US30We expected US30 to give us a reaction from above 43.5K, market has given us more than 2K points move, now we will wait for the correction before any more buys.
Disclosure: We are part of Trade Nation's Influencer program and receive a monthly fee for using their TradingView charts in our analysis.
DowJones key trading level at 43220Key Support and Resistance Levels
Resistance Level 1: 44520
Resistance Level 2: 44930
Resistance Level 3: 45280
Support Level 1: 43220
Support Level 2: 42830
Support Level 3: 42460
This communication is for informational purposes only and should not be viewed as any form of recommendation as to a particular course of action or as investment advice. It is not intended as an offer or solicitation for the purchase or sale of any financial instrument or as an official confirmation of any transaction. Opinions, estimates and assumptions expressed herein are made as of the date of this communication and are subject to change without notice. This communication has been prepared based upon information, including market prices, data and other information, believed to be reliable; however, Trade Nation does not warrant its completeness or accuracy. All market prices and market data contained in or attached to this communication are indicative and subject to change without notice.

Trendline / Channel retestDJI hits this trendline / channel bottom again. I expect a rejection and a correction from it. It's not a classic channel, so a false break-in is allowed.
US30lets look at the Correlations between US30, US10Y, DXY and fed Interest Rates
us10y and dollar are like react in a similar way, when the US10Y is rising ,it attracts foreign capital into us economy and the dollar benefits from capital inflow and strengthens in the process
US10Y and DXY (US Dollar Index):
the current tariffs and geopolitical events caused temporary decoupled this correlation but the correlation has reverted to positive alignment as of June 2025. Higher yields now signal renewed confidence in the US economy, lifting both yields and the dollar.
US30 (Dow Jones) and DXY,they have inverse correlation in such a way that when the dollar is weak it causes a boost of US30 by enhancing multinational corporate earnings as cheaper export brings in higher overseas revenue
there are Exception when we experience Simultaneous strength in DXY and US30 during "risk-on" global confidence
US10Y and Interest Rates (Federal Funds Rate):
Direct Link: US10Y reflects market expectations for Fed policy. Anticipated rate hikes lift yields; expected cuts lower them.
Current Context: With the Fed holding rates at 4.25–4.50%, US10Y (4.26%) remains sensitive to inflation data and future cut expectations.
US30 and Interest Rates has Inverse Pressure when rate are Higher it increases borrowing costs, potentially dampening corporate profits and stock valuations. Lower rates support equity rallies.
2025 Dynamic: Despite elevated rates, US30 trades near record highs due to resilient growth and tariff-related sector rotations.
Critical Drivers
Yield-Dollar Sync: US10Y and DXY realignment signals market confidence in US assets, but geopolitical/trade risks can disrupt this.
Equity Sensitivity: US30 benefits from dollar weakness but faces headwinds if the Fed delays rate cuts amid sticky inflation.
Interest Rate Outlook: Fed patience (no cuts until September) sustains US10Y-DXY positivity but caps explosive US30 gains.
watch my supply roof and demand floor for reaction.
#us30

US30 Pullback then LongLooking for the pullback then on on bullish PA look for the entry. Wait for breach below then push back up and bullish PA close then plan entries.

Dow Jones in Long-Term Fibonacci Channel📈 Dow Jones Weekly | Fibonacci Channel in Play Since 2020
The Dow Jones Industrial Average has been trending within a well-defined Fibonacci channel on the weekly timeframe since the 2020 lows.
🔹 The price has consistently respected the Fibonacci levels as tilted support and resistance lines—a technical behavior that adds weight to this structure.
🔹 Three major horizontal support/resistance zones are clearly active and validated multiple times (highlighted on the chart).
🔹 Currently, the index is approaching the upper boundary of the downtrend resistance.
📌 The setup suggests it's only a matter of time before we retest this dynamic resistance zone, with potential rejection or breakout to follow.
🎯 Target zone around 45,000 as marked—aligning with previous highs and the upper resistance confluence.
Stay tuned—momentum is building.
#DowJones #DJI #FibonacciChannel #TechnicalAnalysis #WeeklyChart #StockMarket #Resistance #Support #Trendlines #ChartAnalysis #TradingView #US30 #MarketOutlook #PriceAction

Bullish bounce for the Dow Jones?The price is falling towards the pivot which has been identified as an overlap support and could bounce from this level to our take profit.
Pivot: 42,588.80
1st Support: 42,119.27
1st Resistance: 43,222.33
Risk Warning:
Trading Forex and CFDs carries a high level of risk to your capital and you should only trade with money you can afford to lose. Trading Forex and CFDs may not be suitable for all investors, so please ensure that you fully understand the risks involved and seek independent advice if necessary.
Disclaimer:
The above opinions given constitute general market commentary, and do not constitute the opinion or advice of IC Markets or any form of personal or investment advice.
Any opinions, news, research, analyses, prices, other information, or links to third-party sites contained on this website are provided on an "as-is" basis, are intended only to be informative, is not an advice nor a recommendation, nor research, or a record of our trading prices, or an offer of, or solicitation for a transaction in any financial instrument and thus should not be treated as such. The information provided does not involve any specific investment objectives, financial situation and needs of any specific person who may receive it. Please be aware, that past performance is not a reliable indicator of future performance and/or results. Past Performance or Forward-looking scenarios based upon the reasonable beliefs of the third-party provider are not a guarantee of future performance. Actual results may differ materially from those anticipated in forward-looking or past performance statements. IC Markets makes no representation or warranty and assumes no liability as to the accuracy or completeness of the information provided, nor any loss arising from any investment based on a recommendation, forecast or any information supplied by any third-party.
