US30Correlation Between US30, 10-Year Bond Yields, Bond Prices, and DXY
1. Bond Prices vs. Yields
Inverse Relationship: Bond prices and yields move inversely. When bond prices rise, yields fall, and vice versa.
Example: If the 10-year Treasury bond price drops (due to selling pressure), its yield rises to attract buyers.
Current 10-year yield: 4.54% (as of May 21, 2025).
2. 10-Year Yield vs. DXY (US Dollar Index)
Typical Positive Correlation: Higher yields attract foreign capital into USD-denominated assets, strengthening the dollar (DXY↑).
Recent Divergence:
A rising 10-year yield paired with a weakening DXY may signal market skepticism about Fed policy or risk aversion (e.g., investors favor Treasuries as safe havens despite lower yields).
Example: If yields rise due to inflation fears without economic growth, DXY may weaken as traders doubt the Fed’s ability to sustain rate hikes.
3. DXY vs. US30 (Dow Jones Industrial Average)
Inverse Correlation: A weaker dollar (DXY↓) often supports equity indices like US30, as multinational companies benefit from cheaper exports and higher overseas earnings.
Exceptions:
In risk-off environments, a stronger dollar (DXY↑) may coincide with equity sell-offs as investors flee to safe-haven assets.
4. 10-Year Yield vs. US30
Mixed Relationship:
Negative: Rising yields can pressure equities (US30↓) as higher borrowing costs reduce corporate profits and make bonds more attractive.
Positive: Yields rising due to growth optimism may lift stocks (US30↑) if earnings expectations improve.
5. Yield Curve Dynamics (30-10 Year Spread)
Current Spread: 0.51% (30-year yield: 4.94%, 10-year yield: 4.43%).
Implications:
A widening spread (30-year > 10-year) suggests long-term growth/inflation expectations.
A flattening/inverted spread signals economic uncertainty or recession fears.
Summary Table of Relationships
Factor Relationship with DXY Relationship with US30
10-Year Yield ↑ Typically ↑ (if growth-driven) ↓ (if rate-driven) / ↑ (if growth-driven)
Bond Prices ↑ ↓ (yields fall, USD less attractive) ↑ (cheaper borrowing)
DXY ↑ — Typically ↓ (hurts exports)
30-10 Spread Widens Neutral ↑ (growth optimism)
Key Scenarios
Risk-On Environment:
DXY↓ + US30↑ + Yields↑ (growth optimism).
Example: Weaker dollar boosts equities despite rising yields.
Risk-Off Environment:
DXY↑ + US30↓ + Yields↓ (safe-haven demand for bonds and USD).
Policy Divergence:
Yields↑ + DXY↓ (markets doubt Fed’s ability to sustain hikes despite inflation).
Conclusion
The interplay between US30, bond yields, prices, and DXY is dynamic and context-dependent:
Yield-DXY Link: Normally positive but can diverge during policy uncertainty or risk aversion.
DXY-US30 Link: Typically inverse but influenced by macroeconomic drivers.
Yield Curve: A widening 30-10 spread supports growth optimism, while flattening signals caution.
Traders must monitor Fed policy, inflation data, and risk sentiment to navigate these correlations effectively.
DOW trade ideas

Dow Jones Continues Its Upward Momentum Toward the 43,344 Level The Dow Jones Industrial Average is showing continued bullish momentum, with an anticipated move toward the 43,344 level following a retracement to the support zone around 42,290–42,250. A price close above last week’s closing level reinforces the bullish sentiment, providing further upward momentum for the index toward the targeted levels outlined in the accompanying chart.
#Dow Jones Industrial Average
#US30
#Technical Analysis
#Chart Patterns
#Price Action
#Global Markets
#Market Outlook
#Swing Trading

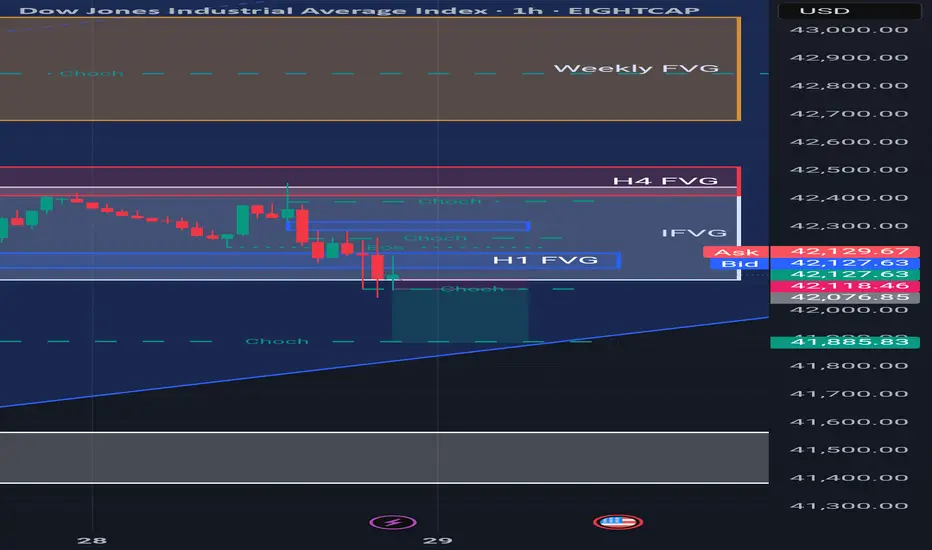
Sell us30 Key Observations:
Market Structure:
Choch (Change of Character) marked → suggests a shift from bullish to bearish structure.
BOS (Break of Structure) below recent lows confirms bearish pressure.
Fair Value Gaps (FVGs):
H1 FVG and IFVG (Internal FVG) have already been touched and price reacted bearishly.
H4 FVG above is unmitigated, acting as a potential supply zone.
Weekly FVG above current price – could be a long-term draw on liquidity but not immediate.
Trendline (Support):
Price is approaching an ascending trendline acting as dynamic support around 41,890 area.
If this trendline holds, a bounce is possible before any further drop.
Price Action:
Strong bearish candles breaking through the H1 FVG.
Sell-side liquidity beneath equal lows and trendline may be the target.
---
🧠 Bias Summary:
✅ Short-Term Bias: Bearish
Reason: BOS + Choch + strong downside momentum + fair value gap fills.
Expectation: Price may seek liquidity below the trendline (41,800–41,600 zone).
⚠️ Watch for a Potential Bounce:
At the trendline zone (41,880–41,900), possible reaction or retracement.
If a strong bullish reaction forms here with displacement, we could see a move back up to fill the H4 FVG.
---
📍 Bias = Bearish, with potential for short-term retracement or liquidity sweep before continuation

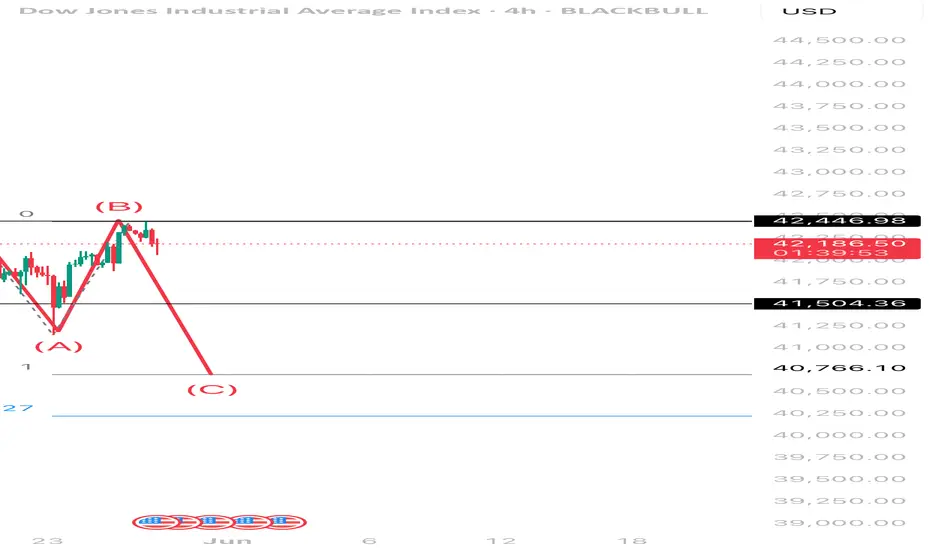
US30 Short - Elliotts Impulse and correction wavesWe see an impulsive move (1-5) and now completing corrective wave (A-C) with targets at Fibonacci extension 1.27

US30 Sell - Elliotts Impulse and Correction We see an impulsive and corrective move, targeting 1.27 Fibonacci level
Dow Jones (US30)The Dow Jones is due to see weakness as the US Dollar finds its footing seeking high prices and attacking 4Hour Resistance structures.
We expect a Bullish US Dollar which supports our Bearish notion on US30.

DOW JONES: Channel Up targeting 43,400.Dow Jones is practically neutral on its 1D technical outlook (RSI = 55.880, MACD = 380.350, ADX = 13.770) as the price is consolidating on its 4H MA50. Despite the neutrality, it remains inside the Channel Up, that is supported by the 4H MA200 and whose 4H RSI squeeze indicates we might be on a similar slow uptrend as late April's. We expect a similar +5.60% rise from the HL bottom, TP = 43,300.
## If you like our free content follow our profile to get more daily ideas. ##
## Comments and likes are greatly appreciated. ##

Price Patterns Every Trader Should KnowLearn how to trade using price patterns! In this video, we cover continuation, reversal, and bi-directional patterns, including flags, wedges, triangles, and more. You'll see schematics, real chart examples, and learn how to combine them with confluence for better setups.
#PriceAction #ChartPatterns #TechnicalAnalysis #TradingStrategy #ForexTrading #CryptoTrading

USA30 updateHi traders as you can see we counter the pull back and I believe you took advantage of it but if you are scared I suggest you use tight stop loss and it's still valid to enter,risk smart thank you

The Dow Jones Begins to Stabilize Around 42,500 PointsThe U.S. index has halted the advance of its recent bullish moves near this resistance zone, mainly because the market is awaiting the release of the Federal Reserve minutes later today, along with Nvidia’s earnings report, expected after the stock market close. For now, investor anticipation has created a neutral sentiment in the index's recent movements as it approaches the 42,500-point resistance, and these upcoming events are likely to provide deeper insight into the market’s direction in the coming sessions.
Possible Bullish Channel
Since early April, the Dow Jones has shown consistent buying movements, attempting to maintain a potential bullish channel. So far, there have been no signs of significant bearish corrections in the price, which suggests that the current bullish pattern remains the dominant structure to monitor in the short term. However, a strong selling correction could put this trend at risk.
Neutrality Intensifies:
MACD: The MACD histogram continues to hover around the zero line, reflecting a sustained equilibrium in the momentum of the moving averages. This highlights a lack of clear direction in the market over the short term.
ADX: The ADX line remains below the 20 level, indicating that volatility is low, a condition not seen since February of this year.
Both indicators point to persistent neutrality, likely driven by market indecision ahead of key fundamental events, as well as the technical resistance zone, which is currently limiting price advances.
Key Levels to Watch:
42,500 points: Current resistance level aligned with the 200-period moving average. It may act as a potential point for bearish corrections.
43,800 points: A distant resistance level not seen since February. If the price rallies to this level, it could reinforce the current bullish formation and strengthen the prevailing upward channel.
41,100 points: A key support aligned with the 50-period moving average. A drop near this level could jeopardize the bullish formation and potentially shift momentum toward a bearish bias.
Written by Julian Pineda, CFA – Market Analyst

Hanzo / US30 30M Path ( Confirmed Bullish Breakout Zones )🆚 US30
The Path of Precision – Hanzo’s Market tactics
🔥 Key Levels & Breakout Strategy – 15M TF
☄️ Bullish Setup After Break Out – 42240 Zone
Price must break liquidity with high volume to confirm the move.
Reasons
Bullish After Break
42250
🚀 1hr key level
Retest - History
27 May / 2025
21 May / 2025
19 May / 2025
16 May / 2025
15 May / 2025
14 May / 2025

Us30 sell . Higher Timeframe Structure (HTF bias) – Look at Daily, 4H, or 1H timeframes.
2. Market Structure (SMC) – Are we in a clear bullish or bearish structure?
3. Premium/Discount Zones – Relative to the recent range.
4. Liquidity Pools – Equal highs/lows, trendline liquidity.
5. Fair Value Gaps (FVG) – Gaps that price might be targeting or rejecting.
6. News & Macroeconomic Context – Especially for indices.
---
As of Now (May 28, 2025) – Please Confirm if You Want a Live Update
If you'd like a real-time bias, I can pull up the latest chart data. Otherwise, here's how to analyze it manually:
---
How to Find Bias for US30 – Example Framework
🔎 Step 1: Check Daily/4H Structure
Higher highs & higher lows → Bullish bias
Lower highs & lower lows → Bearish bias
🔎 Step 2: Identify Liquidity
Look for equal highs/lows – those are likely targets.
🔎 Step 3: Use FVG Zones
If price is inside a bullish FVG and rejecting, bias could be bullish.
If price is filling in a bearish FVG and breaking down, bias could be bearish.
🔎 Step 4: Premium/Discount
Use a Fib from recent swing high to low.
Above 50% = premium → Look for shorts
Below 50% = discount → Look for longs

US30 LONGLong entry taken trading up to TP1 which is a strong POC level
Once price reach's POC could expect a sell off as its in a strong 4 hour level

Long Us30 UpdateUS30 long TP 1 hit I've closed the trade
waiting for Pullback to show its hand to the upside for another push higher
New POC developed this is not to be ignored


US30 H1 | Bullish Bounce Based on the H1 chart analysis, the price is falling toward our buy entry level at 42098.02, a pullback support that aligns with the 61.8% Fibonacci retracement.
Our take profit is set at 42539.90, a pullback resistance that aligns with the 78.6% Fibonacci retracement.
The stop loss is placed at 41774.23, a pullback support.
High Risk Investment Warning
Trading Forex/CFDs on margin carries a high level of risk and may not be suitable for all investors. Leverage can work against you.
Stratos Markets Limited (tradu.com ):
CFDs are complex instruments and come with a high risk of losing money rapidly due to leverage. 63% of retail investor accounts lose money when trading CFDs with this provider. You should consider whether you understand how CFDs work and whether you can afford to take the high risk of losing your money.
Stratos Europe Ltd (tradu.com ):
CFDs are complex instruments and come with a high risk of losing money rapidly due to leverage. 63% of retail investor accounts lose money when trading CFDs with this provider. You should consider whether you understand how CFDs work and whether you can afford to take the high risk of losing your money.
Stratos Global LLC (tradu.com ):
Losses can exceed deposits.
Please be advised that the information presented on TradingView is provided to Tradu (‘Company’, ‘we’) by a third-party provider (‘TFA Global Pte Ltd’). Please be reminded that you are solely responsible for the trading decisions on your account. There is a very high degree of risk involved in trading. Any information and/or content is intended entirely for research, educational and informational purposes only and does not constitute investment or consultation advice or investment strategy. The information is not tailored to the investment needs of any specific person and therefore does not involve a consideration of any of the investment objectives, financial situation or needs of any viewer that may receive it. Kindly also note that past performance is not a reliable indicator of future results. Actual results may differ materially from those anticipated in forward-looking or past performance statements. We assume no liability as to the accuracy or completeness of any of the information and/or content provided herein and the Company cannot be held responsible for any omission, mistake nor for any loss or damage including without limitation to any loss of profit which may arise from reliance on any information supplied by TFA Global Pte Ltd.
The speaker(s) is neither an employee, agent nor representative of Tradu and is therefore acting independently. The opinions given are their own, constitute general market commentary, and do not constitute the opinion or advice of Tradu or any form of personal or investment advice. Tradu neither endorses nor guarantees offerings of third-party speakers, nor is Tradu responsible for the content, veracity or opinions of third-party speakers, presenters or participants.

USA30 next possible moveMorning traders,I decided to share few I deas in smaller time frame as you can see dj open higher this week soo you need to generate liquidity in to position,am expecting market to pull a bit lower however it's been selling for past hours as you can you meaning it might continue with the trend before that I didn't mention but shown in the chart,make sure you are updated in everything soo that you wont be surprised when you see spikes understand them when the occur ls thank you I wish you all best n profitable week.

possibility of uptrendAs long as the index fluctuates above the green support range, the continuation of the upward trend will be likely. Otherwise, the continuation of the correction will be likely.

US30 potential long setupsMulti-Timeframe Market Analysis — Bullish Continuation Potential
3-Month Timeframe
• October 2023: Price broke all-time highs.
• Bullish order block established at $37,250; price rallied to $45,000.
• Strong retracement followed to the $39,000 region—bullish orders filled.
• Current trend: Structure remains bullish with institutional support evident.
Monthly Timeframe
• Post-ATH liquidity collected at $41,750; retested in January with insufficient momentum.
• Price returned to $45,000 before retracing to $38,000.
• Strong bullish response from $38,000 leading into April and May.
• Price now trades above $41,750. A monthly close above this level signals further upside.
• Watch for a three-pin pattern—if confirmed, high probability of a break above previous monthly highs.
• Next target: $45,000 liquidity zone.
Weekly Timeframe
• Double bottom formation aligned with higher timeframes.
• Bullish accumulation at $41,250 drove price to $42,000, followed by a close above that level.
• Immediate resistance at $44,000, where previous bearish orders were concentrated.
• Last week ended with a bearish candle; this week opened with strong bullish momentum from $41,250.
• This timeframe supports a bullish bias, contingent on follow-through above key levels.
Daily Timeframe
• Bullish structure in alignment with monthly and weekly.
• Strong order flow noted at $41,250, enabling a break and close above $42,000.
• Next daily target: $42,800; key resistance: $42,881.
• Anticipate a possible retracement to $42,000 for further accumulation before continuation higher.
4H Timeframe
• Intraday price action highlights Friday’s retracement to $41,250 during NY session—bullish orders filled.
• Monday opened bullish; momentum slowed at $42,000 with brief retracement.
• Tuesday's NY session: 3-pin bullish pattern at $42,000, followed by a bullish close.
• Current price movement appears to be a retracement for more long orders.
• No actionable setup at the moment; monitoring for a clean 4H close above $42,350.
1H Timeframe
• Price encountered resistance at $42,350, a known liquidity region.
• Break and close above $42,300–$42,350 range confirms short-term bullish pressure.
• Awaiting next 4H candle to assess validity of long setup.
• Maintaining a neutral stance short-term; prepared to act on bullish confirmation.
________________________________________
Conclusion:
Very mindful of FOMC meeting minutes today and I am waiting to see what price action will occur after. Market structure across all major timeframes remains bullish. Pending a monthly close above $41,750 and a potential three-pin formation, the technical outlook favors continued upside. Patience remains key—await confirmation for optimal long entries.

Dow Jones Index Local Short! Sell!
Hello,Traders!
US30 index keeps going up
But the price will soon hit
A strong horizontal resistance
Level around 42,876 from where
We will be expecting a local
Pullback and a move down
Sell!
Comment and subscribe to help us grow!
Check out other forecasts below too!
Disclosure: I am part of Trade Nation's Influencer program and receive a monthly fee for using their TradingView charts in my analysis.

Dow Jones : Expecting a correction before bulls step back in📉 Dow Jones Alert
Expecting a correction before bulls step back in. 🐂
Wait for price to pull back to the support zone before entering! 🎯
Patience = Profit 💰

[Scalping] US30 Long (May 27, 2025)Entry was 42388
TP is 42409.4
SL is 42373.72
RR is 1:1.5-2
This is just record purpose with new method to trade.
Please allow this test period.
**I use only session indicator.
Other than that I do not use any indicators
New method can be used only for manual trading.
