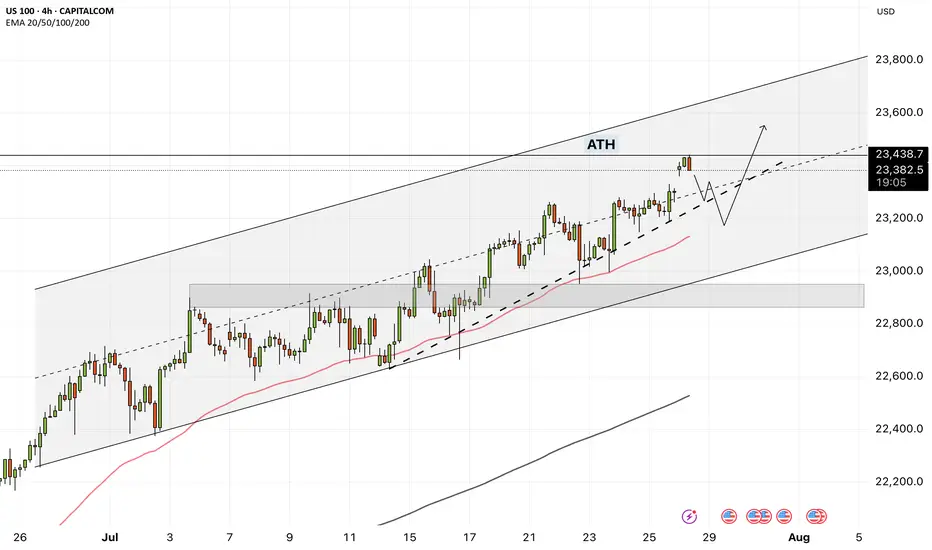
NextGenTraders81 NAS short swingI have my sell limit set at 23,500 as there is alot of sell limits set there, also at 23,550 hence the SL is above that zone.
I am pretty sure the position will be set on BE before it tries to return to these highs, how long it will take to hit TP, who knows.. a correction within the channel is due after numerous ATHs.
If you will follow, take partials on the way !
Good luck :)
NASDAQ trade ideas

"NASDAQ 100 Heist – Scalp, Swing, or Hold? (Full Plan)🔥 NASDAQ 100 HEIST PLAN – BULLISH LOOT AWAITS! 🔥
🚨 Attention Market Robbers & Money Makers! 🚨
(Swing/Day Trade Strategy – High-Risk, High-Reward Play)
🎯 Mission Objective: Loot the NDX100/US100 (NASDAQ 100) Like a Pro!
Based on Thief Trading’s ruthless technical & fundamental analysis, we’re executing a bullish heist—targeting the Red Zone (high-risk, high-reward area).
⚠️ WARNING: Overbought market, consolidation zone, potential bear traps—weak bears may get slaughtered! Strong hands only!
🔐 ENTRY: The Vault is OPEN!
"SWIPE THE BULLISH LOOT!" – Any price is a steal, but smart thieves use:
Buy Limit Orders (15m-30m TF) near recent swing lows/highs.
DCA/Layering Strategy – Multiple limit orders for max loot.
Breakout Confirmation – Don’t jump in early; wait for the real move!
🛑 STOP LOSS: Protect Your Stash!
Thief’s SL Rule: Nearest 4H swing low (22,600) – WICK LEVEL ONLY!
DO NOT place SL before breakout! (Patience = Profit.)
Adjust SL based on risk, lot size, and number of orders.
🎯 TARGETS: Escape Before the Cops Arrive!
Main Take-Profit: 24,400 (or exit early if momentum fades).
Scalpers: Longs ONLY! Use trailing SL to lock in profits.
Swing Traders: Ride the wave like a true market pirate!
📰 FUNDAMENTAL BACKUP: Why This Heist Will Work
Bullish momentum in NDX100 driven by:
Macro trends (Fed, inflation, tech earnings).
COT Report & Institutional positioning.
Geopolitical & Sentiment Shifts.
Intermarket correlations (USD, Bonds, Tech Sector).
(Stay updated—markets change FAST!)
⚠️ TRADING ALERT: News = Danger Zone!
Avoid new trades during high-impact news.
Trailing SL = Your best friend.
Lock profits early if volatility spikes!
💥 BOOST THIS HEIST! 💥
👉 Hit LIKE & FOLLOW to strengthen our robbery crew!
🚀 More heists coming soon—stay tuned, thieves! 🚀

NASDAQ & NFP- I expect BullishnessHello fellow traders,
Today is NFP and I expect a bulishness as per my PD Arrays analysis. Lets se if it words out.
I have higlighted all important PD Arrays in my chart, keep an eye.
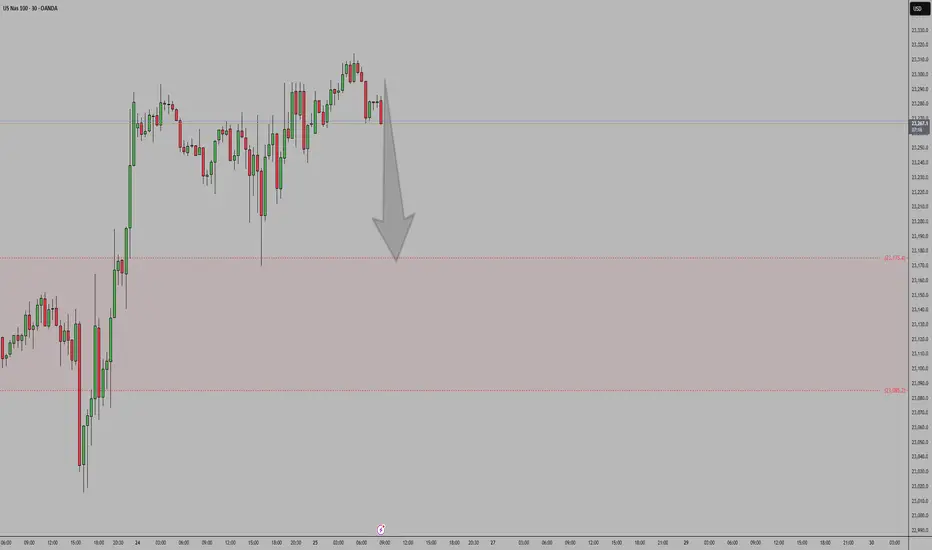
Us100 short position 24/07/2025English : According to our analysis, we anticipate a bearish scenario.
Morocan Darija : kanchofo d'apres l'analyse dyalna antsanaw hboot
ATENTION : I only share my ideas, not signals
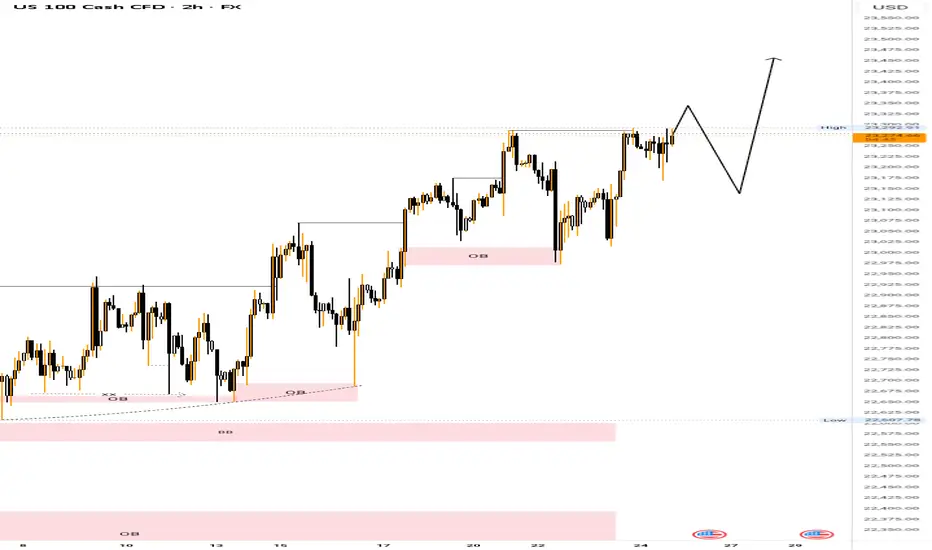
NAS100 steadies at high levels, pay attention nextThe most recent move on NAS100 saw a sharp drop that briefly recovered, likely triggering stops before aggressively reversing from the lower boundary of the newly projected channel. This isn't a cause for concern, on the contrary, it's another opportunity to get involved.
That is because this drop and recovery is a common behavior in strong uptrends before resuming bullish momentum.
The market is likely in the early stages of a new impulsive leg to the upside right here.
We could either have short-term consolidation or pullback, then a continuation toward the upper channel boundary or straight upwards, and with NAS100, the latter is more plausible.
My target will be at 23,300 around the upper boundary of the projected channel resistance.
In this context, the market remains bullish clearly. The most interesting aspect is the emotional flush on the last drop, trapping sellers before fueling what could be another big leg up.

Possible direction bias on Nas100FX:NAS100 Now the price is still uptrending and those that think the price is high and want to sell might get their ass wipe. After the break of the current high, I expect a pullback to sweep the LIQ of the low that cause the break and then continue to the upside.
NAS100 - How will the stock market react to the FOMC meeting?!The index is trading above the EMA200 and EMA50 on the four-hour timeframe and is trading in its ascending channel. The target for this move will be the ceiling of the channel, but if it corrects towards the indicated support area, you can buy Nasdaq with better reward-risk.
As signs of easing global trade tensions begin to emerge, the Federal Open Market Committee (FOMC) is scheduled to meet this week. Analysts widely expect the Fed to hold interest rates steady for a fifth consecutive time. This anticipated decision comes as the U.S. President continues to push for rate cuts, persistently pressuring the Fed to adopt a more accommodative monetary stance.
So far, the Federal Reserve has kept its benchmark rate within a range of 4.25% to 4.5%. While some officials project two cuts by the end of the year, markets are waiting for the Fed’s patience to run out. According to the CME Group’s FedWatch tool, investors have priced in a 62% chance of a rate cut in the September meeting. By then, the Fed will have access to the July and August employment reports—key indicators of whether the labor market is weakening or remains resilient.
The upcoming week marks the peak of Q2 earnings season, with 37% of S&P 500 companies reporting results, including four major tech firms. In parallel, the August 1st tariff deadline for the EU and other countries is approaching, while legal challenges over existing tariffs remain ongoing.
According to a report by The Wall Street Journal, many large U.S. corporations have so far absorbed the bulk of tariff-related costs without passing them on to consumers. This strategy aims to maintain market share and avoid drawing criticism from President Trump. However, the question remains—how long can this continue?
Examples from the report include:
• General Motors paid over $1 billion in tariffs in Q2 alone without announcing any price hikes.
• Nike expects a $1 billion hit from tariffs this fiscal year and is planning price increases.
• Hasbro is working on a combination of price hikes and cost cuts to offset $60 million in tariff impacts.
• Walmart has made slight pricing adjustments (e.g., bananas rising from $0.50 to $0.54) and managed pressure through inventory reductions.
This week is shaping up to be one of the busiest on the economic calendar in recent months. A flood of key data on growth, inflation, and employment, alongside three major interest rate decisions, has markets on high alert.
On Tuesday, attention will turn to two significant reports: the Job Openings and Labor Turnover Survey (JOLTS) and the U.S. Consumer Confidence Index for July. These metrics will offer a clearer view of labor market dynamics and household sentiment heading into critical monetary policy decisions.
The most anticipated day is Wednesday. That day brings the ADP private payrolls report, the first estimate of Q2 GDP, and pending home sales data. Additionally, both the Bank of Canada and the Federal Reserve will announce rate decisions—events with the potential to simultaneously steer global market trajectories.
On Thursday, the July Personal Consumption Expenditures (PCE) price index will be released—a key inflation gauge closely monitored by the Fed. Weekly jobless claims data will also be published that day.
The week concludes Friday with two heavyweight economic indicators: July’s Non-Farm Payrolls (NFP) report, a crucial input for Fed policy decisions, and the ISM Manufacturing PMI, which offers insights into the health of the real economy.
Some economists argue that a September rate cut may be premature, and even suggest that no rate changes might occur in 2025. Analysts expect Fed Chair Jerome Powell to reiterate a data-dependent stance, consistent with previous meetings.
Still, beyond political dynamics, the July meeting holds independent significance.The Fed’s internal policy tone is gradually leaning more dovish, and subtle signals of this shift may emerge in the final statement. Given that only one meeting remains before September, if policymakers are leaning toward a rate cut then, it’s critical that the groundwork for such communication be laid now.
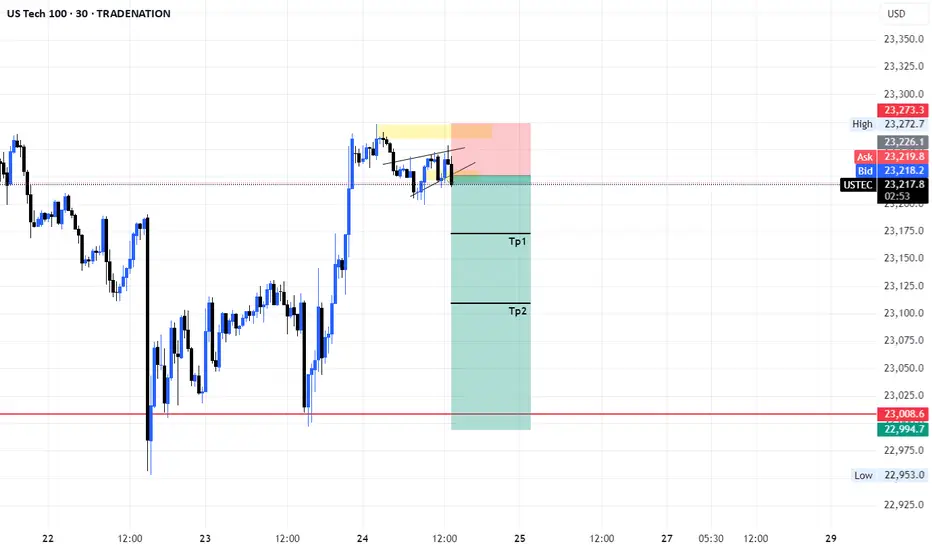
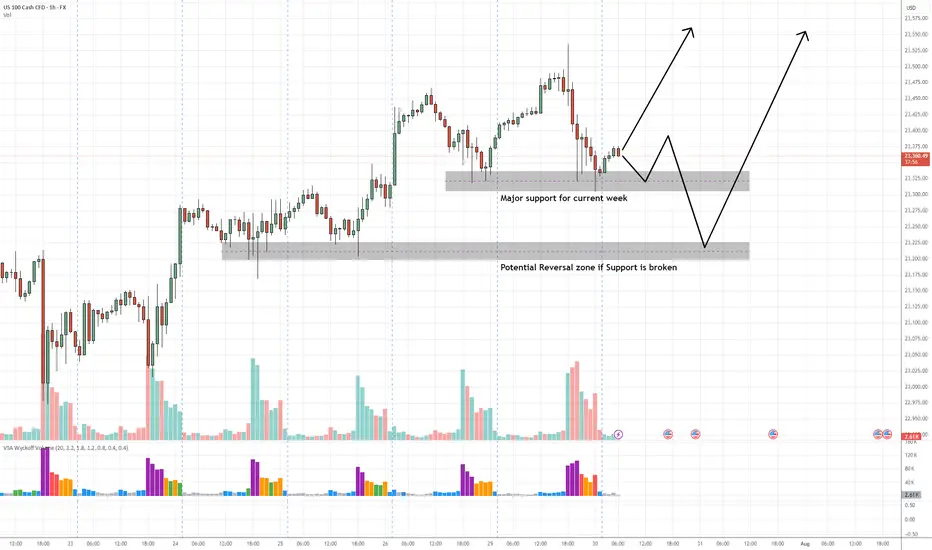
NAS100 Buy Setup – VSA & Multi-Zone Demand Analysis✅ Primary Entry Zone: Major support for current week (around 23,325–23,350)
✅ Secondary Entry Zone: Potential reversal zone if primary support is broken (around 23,200–23,230)
🎯 Target 1 (TP1): Previous swing high near 23,500
🎯 Target 2 (TP2): Extension above 23,550
🛑 Stop Loss (SL): Below 23,170 (beyond secondary reversal zone to avoid false breaks)
📊 Technical Insight (VSA & Price Action Structure)
Support Structure:
The current major support zone has been tested multiple times with no follow-through selling, indicating strong buying interest from larger players.
Volume Spread Analysis Observations:
On the recent decline into the major support zone, we see wider spreads on high volume followed by narrow range candles on lower volume, a classic sign of stopping volume and supply exhaustion.
Within the secondary reversal zone, historical reactions show climactic volume spikes leading to sharp reversals, suggesting this level is watched closely by smart money.
Any test back into the zone on low volume would confirm the No Supply (NS) condition.
Trade Pathways:
Scenario 1: Price respects the major support and begins to climb, confirming demand dominance → target TP1 then TP2.
Scenario 2: Support is temporarily breached, triggering a liquidity grab into the secondary reversal zone, followed by a bullish reversal bar on high volume → strong buy signal with potentially faster move toward TP levels.
📍 Bias: Bullish as long as price holds above the secondary reversal zone.
📌 Execution Tip: Wait for a wide spread up-bar on increased volume from either zone to confirm the start of the markup phase.
Nasdaq bearish nasdaq after taking out liquidity short term based and more bearish momentum can be expectected .
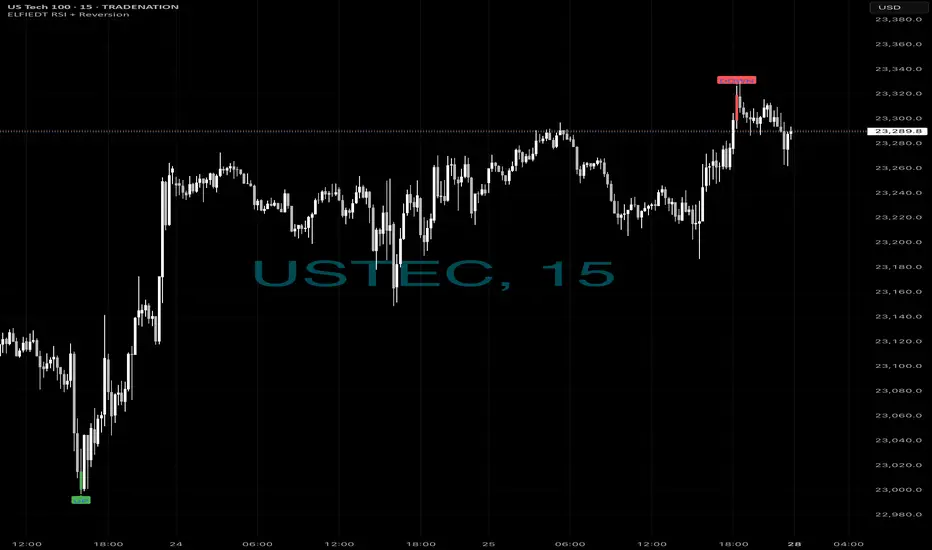
Longs then short - $$$🚀 Caught the Bottom. 🔻 Sold the Top.
Same chart. Same system. Same day.
While most traders were guessing,
ELFIEDT RSI + Reversion was sniping both ends on the US Tech 100.
📍 Long Signal:
At the dead low — green UP arrow fired.
The reversal followed instantly. Momentum exploded.
📍 Short Signal:
At the top of the rally — red DOWN printed.
Perfect spot. Price reversed hard within 1 candle.
⸻
🎯 How It Works:
✔️ Combines RSI overshoots + volatility reversion
✔️ Filters false signals using structure + time of day
✔️ Works on any index or FX pair
✔️ Real-time signals. No lag. No repainting.
⸻
💡 These weren’t “lucky trades.”
They were high-probability SETUPS.
Backed by logic. Confirmed by RSI extremes.
And now? Proven on the chart.
⸻
👉 Want to catch the next reversal like this?
💬 DM me “USTEC” or drop a 🚀
🔒 Access is limited to serious traders only.
📲 Follow for daily setups & training.
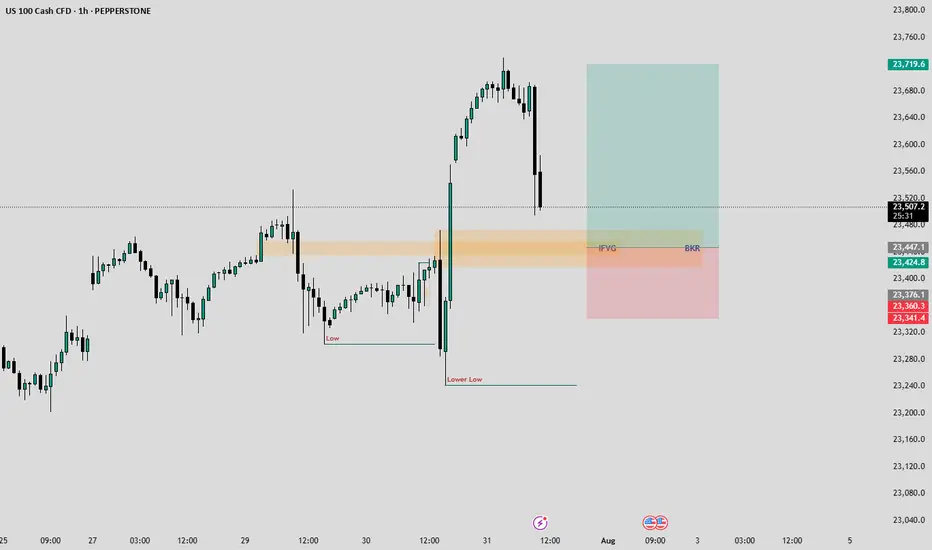
NASDAQ-Lets catch 250 Points togetherHello Fellow Traders,
Nasdaq has been wild since a time now. Today, I have spotted a rade to share with my fellow traders.
Yesterday closed with a good bullish candle. As the NY seesion has begun now, I am anticipating price to retrace to the highlighted breaker block that accurately aligns with an IFVG as well.
I am waiting for the price to fall into my area where I will monitor price's reaction, if we see signs of ejection from the highlighted areas, I wuld love to take a Buy Trade.
Entry= If rice enters the Breaker and IFVG and shows a good rejection.
SL= 23340
TP= Today's highs or 23700.
Manage your risk according toyour capital and only enter the trade if we happen to see a good rejection from the area. Be patient and don't hurry.
NAS100 - BUYHuge drop as expected today. Now that we are reaching its key level of interest, I will wait for a buy confirmation to take our last nights highs.
NAS100 Gaps Up on Trump Trade Deal – Bullish Continuation The market opened with a bullish gap after Trump announced new trade deals, sparking investor optimism. Price cleanly broke above the 23,266.5 🔼 resistance level, confirming it as a fresh support zone.
Buyers are now in full control, and price is forming a strong bullish structure with higher highs and higher lows.
Support at: 23,266.5 🔽, 23,200 🔽, 23,025 🔽
Bias:
🔼 Bullish: As long as price holds above 23,266.5, the path is clear for a move toward 23,400 and possibly 23,540+. Watch for minor pullbacks into support for continuation setups.
🔽 Bearish: A break back below 23,266.5 would be the first warning of bullish exhaustion, with downside potential toward 23,200.
📰 News Insight: The bullish gap came after Donald Trump announced new trade deals, boosting risk sentiment across U.S. indices. This has become a key short-term fundamental catalyst.
📛 Disclaimer: This is not financial advice. Trade at your own risk.

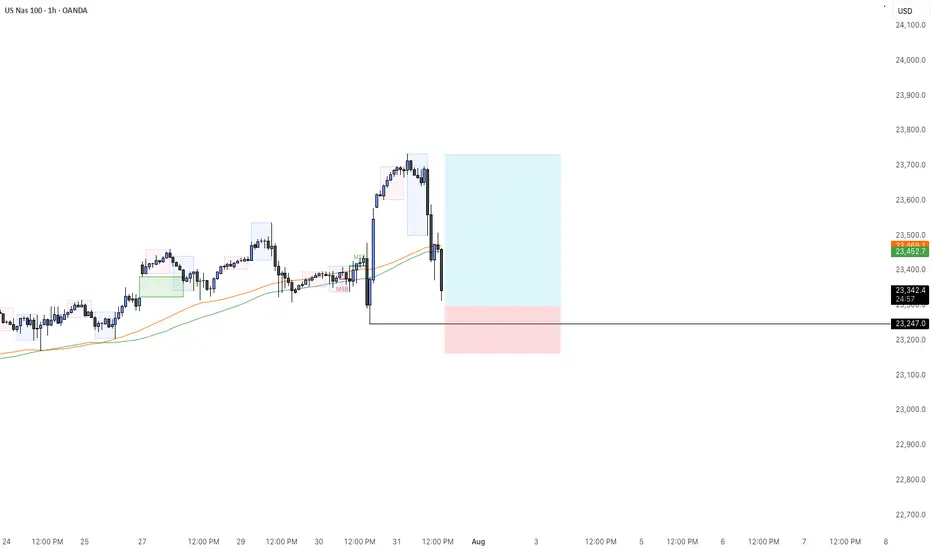
US100 Buy-Limit on Support 4HUS100 Buy-Limit on Support 4H
01-08-25
06:57 PM
Low Risk Trade because market is bearish!
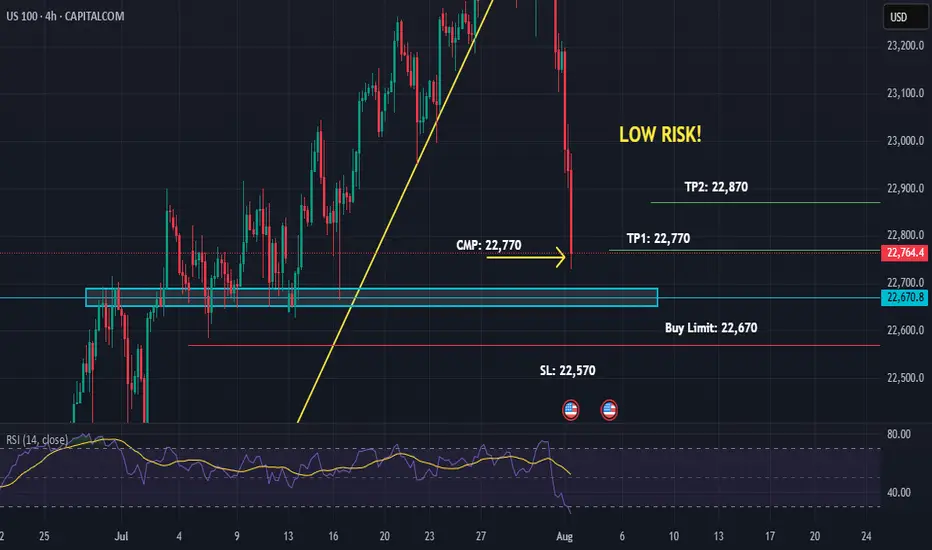
US100US100 is in reversal trend.
Alligator mouth is closed which shows trend will be reversal from here.
Divergence also indicates trend will go down
We sell at CMP.
Nasdaq Index Analysis (US100 / NASDAQ):The Nasdaq index continues its medium- to long-term uptrend and has recently reached a new high at 23,466 USD.
1️⃣ A break and close below 23,200 USD could lead to a pullback toward 23,000, followed by 22,920 USD.
2️⃣ However, if the price holds above 23,330 USD, further bullish continuation is expected, potentially leading to a new all-time high.
⚠️ Disclaimer:
This analysis is not financial advice. It is recommended to monitor the markets and carefully analyze the data before making any investment decisions.

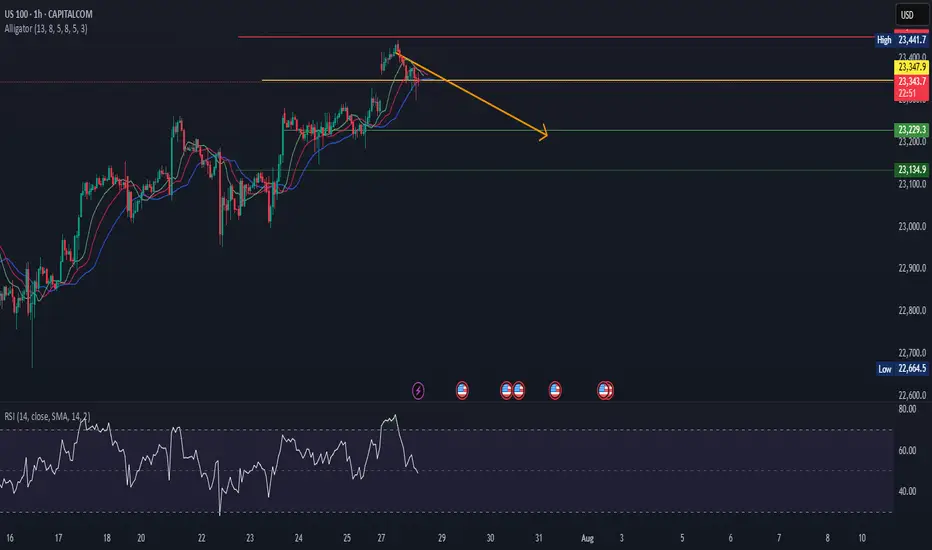
US100Us100 is in reversal MOde.
Big bearish divergence also shown in RSI.
Alligator alos indicates trend will go down from here.
we sell at CMP>
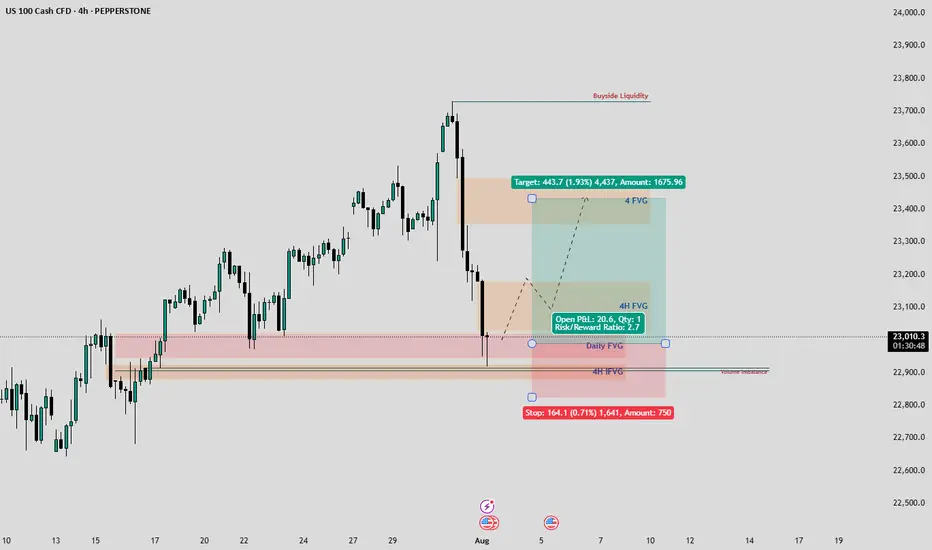
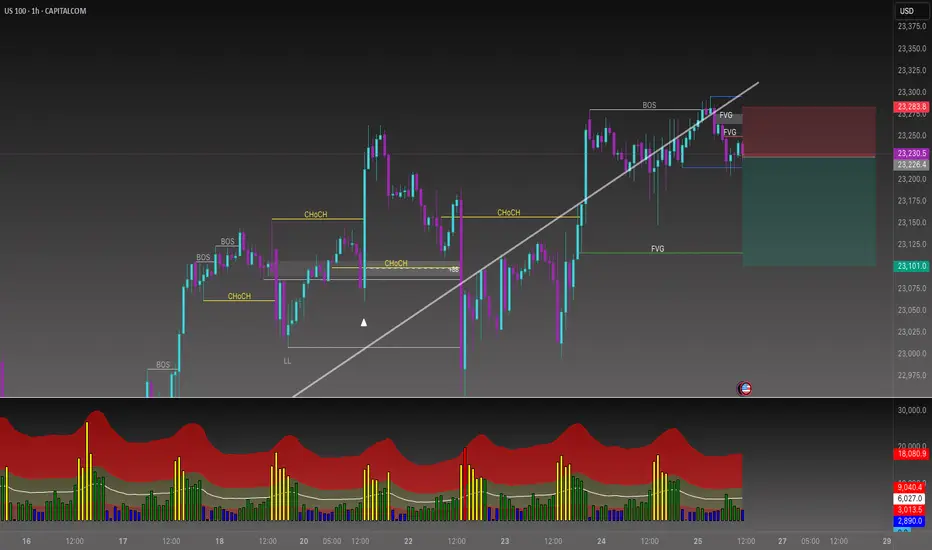
Do you want to keep buying NAS100?📉 Sell-Side Bias Activated
After PEPPERSTONE:NAS100 confirming the trend shift with a clean Break of Structure (BOS) and a strong rejection from the FVG (Fair Value Gap) zone, price failed to hold above 23,275.
This move validated the liquidity sweep and imbalance fill. Multiple FVGs stacked above suggest premium pricing and further downside potential.
🧠 I’m now watching for continuation setups toward discount zone. Especially below 23,100 and possibly targeting the lower FVG region.
This is a classic smart money play, manipulation, BOS, FVG retest, and selloff.
🔻Bias: Bearish
🎯 Target: Liquidity pools below 23,100
🛑 Invalidated above 23,280 (structure reclaim)
NAS100 MAY FORM THE BEARISH HEAD AND SHOULDERS.NAS100 MAY FORM THE BEARISH HEAD AND SHOULDERS.
NAS100 has been trading sideways since the beginning of the week, forming local highs with lows staying at same price for the most part. The price seem to form the Head and Shoulders reversal pattern
What is a Head and Shoulders?
A Head and Shoulders pattern is a reversal chart pattern signaling a potential trend change. It consists of three peaks: two lower "shoulders" and a higher "head" in the middle, connected by a "neckline" (support level). A bullish (inverse) Head and Shoulders forms at a downtrend's end, signaling an uptrend; a bearish Head and Shoulders forms at an uptrend's end, signaling a downtrend.
Currently the SMA50 is pushing on NAS100 from above, while SMA200 is supporting the price. In case the SMA200 on 30-m minutes timeframe gets broken, we may see the decline towards 23,200.00 support level.

NASDAQ Bulls Pushing – Will 20,347 Hold or Break?Price is currently approaching the 20,347 🔼 resistance zone after a strong bullish rally from the 19,150 🔽 support level. The market structure remains bullish with consistent higher highs and higher lows, showing strong buyer momentum.
Support at: 19,670 🔽, 19,150 🔽, 18,500 🔽, 17,600 🔽
Resistance at: 20,347 🔼, 20,600 🔼, 21,000 🔼
Bias:
🔼 Bullish: If price breaks and holds above 20,347 🔼, we could see a continuation toward 20,600 and 21,000.
🔽 Bearish: A strong rejection from 20,347 🔼 could send price back down toward 19,670 and 19,150 for a retest.
📛 Disclaimer: This is not financial advice. Trade at your own risk.

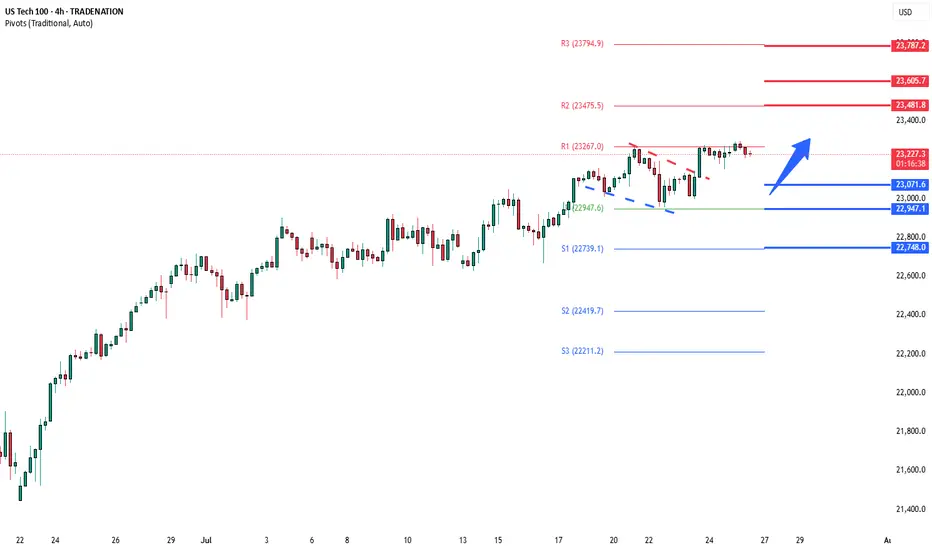
NSDQ100 pushing to new ATH?Thursday was a slightly positive session for equities, with the NASDAQ 100 rising +0.18% to close at a fresh record high, driven by strong economic data. However, overall market action was subdued, with the S&P 500’s trading range the narrowest since February (0.35%).
Notably, the equal-weighted S&P 500 fell -0.33%, highlighting underlying weakness outside mega-cap tech.
A key drag on the NASDAQ came from Tesla (-8.20%), which slumped after disappointing earnings. This weighed on the Magnificent 7, which declined -0.21% despite gains in the other six members.
On the macro front, the US dollar strengthened as Donald Trump downplayed his dispute with Fed Chair Jerome Powell, though continued to pressure the Fed on interest rates. Meanwhile, the FCC approved Paramount’s merger with Skydance, signaling a green light for M&A activity in media despite political tensions.
Conclusion – NASDAQ 100 Trading View:
The NASDAQ 100 remains technically bullish, setting new highs amid resilient economic data. However, breadth is weakening, and headline risk—especially around earnings (e.g., Tesla)—could trigger short-term volatility. Traders should stay long with caution, watching for sector rotation or profit-taking near highs, and monitor Fed-related rhetoric for macro-driven moves.
Key Support and Resistance Levels
Resistance Level 1: 23480
Resistance Level 2: 23600
Resistance Level 3: 23790
Support Level 1: 23070
Support Level 2: 22950
Support Level 3: 22750
This communication is for informational purposes only and should not be viewed as any form of recommendation as to a particular course of action or as investment advice. It is not intended as an offer or solicitation for the purchase or sale of any financial instrument or as an official confirmation of any transaction. Opinions, estimates and assumptions expressed herein are made as of the date of this communication and are subject to change without notice. This communication has been prepared based upon information, including market prices, data and other information, believed to be reliable; however, Trade Nation does not warrant its completeness or accuracy. All market prices and market data contained in or attached to this communication are indicative and subject to change without notice.
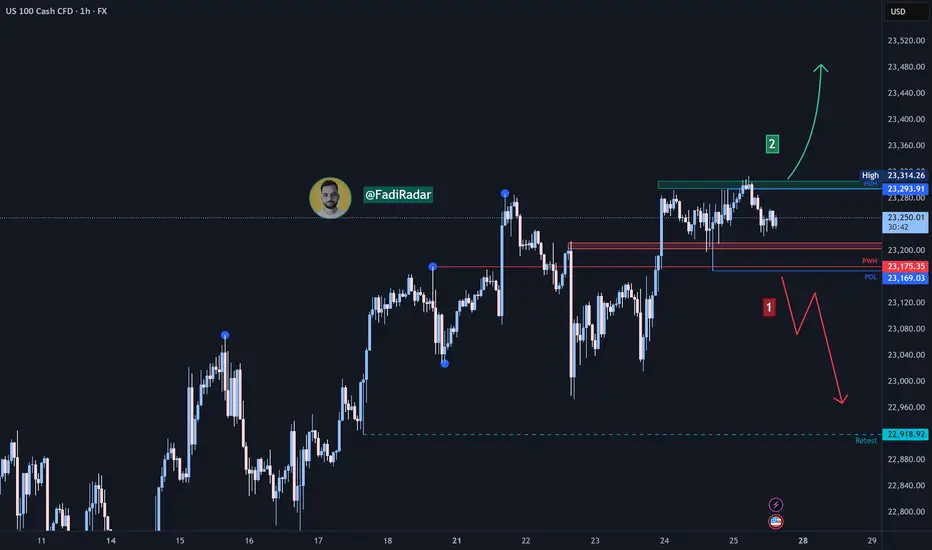
Nasdaq Index (US100 / NASDAQ) Technical Analysis:The Nasdaq index continues its medium- to long-term uptrend. Yesterday, it tested the 23,170$ level and rebounded upward, reaching 23,310$.
🔹 Bearish Scenario:
If the price breaks and closes below 23,200$, it may decline toward 23,000$, followed by 22,920$.
🔹 Bullish Scenario:
If the price holds above 23,300$, the uptrend is likely to continue toward a new high near 23,400$.
⚠️ Disclaimer:
This analysis is for educational purposes only and does not constitute financial advice. Always monitor the markets and perform your own analysis before making any trading decisions.
NASDAQ100 continue its strength due to the strong earning seasonFundamental:
USTEC (NASDAQ100) continues its strength, propelled by robust Alphabet (GOOG) earnings that buoyed technology companies. Cloud services recorded the largest growth at 32% YoY, primarily driven by AI. Concurrently, the company plans to allocate $85 bln to capital expenditure in 2025 for AI, an increase from $75 bln, signaling continued surging demand for AI infrastructure.
In addition, recent US economic data indicated strong consumption and optimism, with the July Services PMI expanding to 55.2 from 52.9 in the previous month. Initial Jobless Claims also fell to 217k, the lowest in 14 weeks, reinforcing optimism regarding the labor market, alongside stronger-than-expected Nonfarm Payrolls from early July.
Inflation data showed a minor impact from tariffs, and tariff negotiations have progressed favorably. Trade deals have been secured with Vietnam, Indonesia, Japan, and the Philippines, and potential trade agreements with the Eurozone and India are anticipated before the deadline.
Major earnings releases are slated for next week, including MSFT, META, and QCOM on July 30. AMZN and APPL's results the following day could provide a clearer picture of USTEC's overall earnings.
Meanwhile, USTEC's forward P/E currently stands at 27x, aligning with its 5-year average despite reaching a new record high, suggesting further upside potential.
Technical:
The index is trading above its EMAs, which are extending, signaling a continuation of the rally.
If USTEC sustains its momentum, the index may reach 24000 upon breaking above the potential resistance at 23400.
Conversely, a pullback near the swing high may suggest a retest of the support at 23000.
