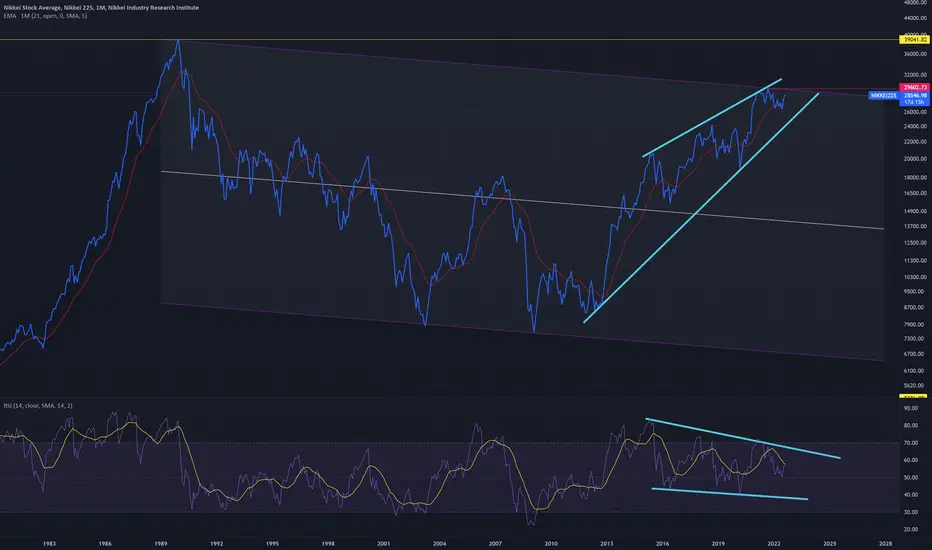
Nikkei225This chart of the Nikkei225 stock average shows that this market topped in 1989 and a parallel channel of a down trend that has recently encountered resistance. The question is whether the price can break above this level and resume the recent bull market or whether the continuation of this extremely long term down trend will happen.
NIKKEI trade ideas
NI255 1HTrend analysis:
4H - Up trend
1H - Range
Pattern analysis:
- After again one cycle, bearish pattern

NIKKEI 225 CFD BEARISH PATTERNJapan Economy Watchers Current Index was announced yesterday, below its forecast and also below its neutral line of 50, at 43.8, which can be used as a marker for downturn of the country's economy.
On a technical level Japan 225 CFD broke the support of the rising wedge pattern, also signaling a potential bearish move on the instrument. Both MACD and RSI indicators confirm the pattern, and in both the fast moving average is increasing the gap with the slow moving average, indicated best by the MACD histogram. This might be read as an indicator for big movement.
If the pattern gets confirmed the price might test its previous low at 27840. If the opposite scenario occurs, the instrument might test the previous support of the rising wedge at 28270.
Risk Disclosure: Trading Foreign Exchange (Forex) and Contracts of Difference (CFD's) carries a high level of risk. By registering and signing up, any client affirms their understanding of their own personal accountability for all transactions performed within their account and recognizes the risks associated with trading on such markets and on such sites. Furthermore, one understands that the company carries zero influence over transactions, markets, and trading signals, therefore, cannot be held liable nor guarantee any profits or losses.

NIKKEI 225 BUYCONFIRMATIONS
- I believe price is going to fall for the next 12-14 hours however reverse of the ascending redline located on my fib at 27962.
- I never want to say this is a "prime example" because things can change. But this is a pretty regular chat pattern that is forming a "rising wedge". This is a chart pattern I look for very often.
- Price has continued to respect my ascending trend line.
- Price is simply in an uptrend.
- 50 MA is right under price.
- Risk/Reward is 3:1
- Waiting for a shooting star or inverted hammer candlestick.


Nikkei 225 August 5th, 2022Nikkei has been rallying in the last few days, and broke a trend line. Everyone is wondering is it a reversal move or just a bull trap.
This is remain to see but for now I see pretty strong base to go higher. Saying that RSI is quite high, not oversold yet but compering to US indices JPN225 is less like to be severely oversold. Very likely the pullback is expected.
MACD looked like it was going to cross the signal line but not really, we might have one/two more bullish/consolidation days.
I'm going short but please do your own analysis - trading is risky

" JP225 " Buy Trade With 300 Pips Target Good Morning Trader's ,, How Are You Today ?
Let's Explain Together "JP225" Chart And Reasons To Long From This Area !
1- What Is The Trend For Jp225 ? Now ,, It's In Upper Trend ,, Because We Break Out The Last resistance Area And Going To Next Level
2- Why We Will Buy From This Area ? We Have Break Out SMC Area And Resistance Area ,, So We Will Going To Target
3- When We Close e Target As Stop Lose ? When The Price Close Daily Candle Down The SMC Area On Chart
Any Questions Please Write me On Comments !

NIKKEI 225 SHORTCONFIRMATIONS
1. JPN22 is in a current uptrend. Price usually gets rejected in this area. In order for price to push more up, it will most likely need to drop to my -27 extension on my fib before pushing more up.
2. Waiting for price to possibly hit my 50% retracement level to sell entry.
3. Double tops have formed which is a sign of a downtrend.
4. Chart could possibly be forming a rising wedge pattern or a bearish pennant.
5. However I could be possibly wrong there isn't much going on in the economic calendar, so price could continue to consolidate and big moved MIGHT not happen until later. Im not 100% sure.
6. Risk/Reward 4:2
7. 50 moving average is about to be over price.
8. Im bearish on JPN225 short term but bullish long term

Nikkei filling a gapI think the Japanese and Asian markets will anticipate what will happen this week.
After a false breakout of a diagonal resistance marked in blue, there is a high chance of filling the gap that was left open, reaching at least as far as the correction of 0.618.
Then we will have a better definition.

Nikkei 225: triple top patternIt will appear that a triple top pattern is busy developing.
Such a pattern is bearish in nature (see the insert).
The 200-day simple moving average might also act as major resistance.
Remains a risky trade.

j225 sellThe price is in an ascending channel and has reached the ceiling of the channel. If the specified trend line is broken, I expect the price to reach the set target.


NI225 (BUY)We have a new emerging uptrend highlighted by the black line. If we cross the line of 28328.53 yen, we can consider a purchase in the short term.

NIKKEI - Gartley completion on the Spike high.OANDA:JP225USD Has completed a Gartley Sell signal this morning on the open of the Asia Session.
The Daily AI had a top at that time as well.
First area to watch will be around 26300-26430 area below there would set up a 25500 Double bottom.
If it gets up above 27k then we will be looking at 27500-27800 bigger Gartley area.
Some levels to watch. Enjoy the day.

Nikkei - 4 Hour - Triangle Breakout We're seeing this setup across a few indices but here on the Nikkei we've recently had a completed ascending triangle pattern which has broken to the upside & is now starting to consolidate.
My initial prediction was that IF we break to the upside from this ascending triangle THEN we're likely to continue higher.
Now the question is IF we're likely to continue higher THEN where are we likely to go & how are we likely to get there.
The answer to the first question is our most recent major level of structure resistance & the answer to the second question is either by a pullback to previous structure resistance (now turned potential support) or by the formation of a high & tight flag pattern followed by another breakout.
Hope this idea was helpful. if you have any questions, comments or want to share your opinion fee free to leave them in the comment section below.
Also, if you're around I host a TRADE OF THE DAY Live Stream here on Tradingview each Tues, Wed & Thurs at 7:30 am NY, 12:30pm UK time. Feel free to join the discussion.
Akil

Long JP225Price Pullback at Downtrend Line Breakout Level
Entry : 26650
Target : 27200
Stop Loss : 26200


NIkkei 4H chart.Jp225 is in downtrend and as you can see it is corrected the price(correction in 1H chart as well). And going to strong impulse asap.

Jamie Gun2Head - Selling NikkeiTrade Idea: Selling Nikkei
Reasoning: Targeting 78.6% Fibonacci, price breaking below support
Entry Level: 26708
Take Profit Level: 25893
Stop Loss: 26871
Risk Reward Ratio 5:1
Disclaimer – Signal Centre. Please be reminded – you alone are responsible for your trading – both gains and losses. There is a very high degree of risk involved in trading. The technical analysis , like all indicators, strategies, columns, articles and other features accessible on/though this site is for informational purposes only and should not be construed as investment advice by you. Your use of the technical analysis , as would also your use of all mentioned indicators, strategies, columns, articles and all other features, is entirely at your own risk and it is your sole responsibility to evaluate the accuracy, completeness and usefulness (including suitability) of the information. You should assess the risk of any trade with your financial adviser and make your own independent decision(s) regarding any tradable products which may be the subject matter of the technical analysis or any of the said indicators, strategies, columns, articles and all other features.

Japan offers an avenue in a violent global value rotation2022 has marked a turn of events for Japan. The once regarded safe haven yen, has declined the most (-11.3%) among G101 currencies this year2. A large part of the Yen’s decline is rooted in the widening of policy divergence between the US and Japan.
China, alongside Japan, is the only real major economy easing policy in 2022. The Bank of Japan (BOJ) also recently announced unlimited buying of 10-year Japanese government bonds (JGBs) to stem any movement higher in long-term borrowing costs above 25 basis points (bps). This divergence in policy stance is even more apparent with the Federal Reserve’s (Fed) plan to reduce its large balance sheet through a “fast runoff” that might pressure the long end of the US yield curve higher. Historically very low interest rates in Japan made borrowing in Yen attractive. But now with other currencies in a similar position of offering zero (or negative) rates on the currency many years out, the Yen lost its competitive edge on the famous carry trade.
Hedging costs are now rising along with global short-term rates, particularly in the US. This could cause even more Yen selling as investors’ demands for US dollars increase, and they seek the higher levels of interest rates available in the US markets without hedging the currency’s movements.
The weaker Yen bolsters the case for Japanese exporters
The weaker Yen has widespread implications for the Japanese equities since Japan is a market that generates a large portion of its revenue from global markets. So, a weaker Yen supports its profit outlook, thereby making Japanese exporters more competitive than global peers. This theory was validated on March 25, in an address to the Japanese parliament by the Bank of Japan Governor Haruhiko Kuroda who said, “There is no change in the basic structure that a weaker yen has positive effects on the Japanese economy by pushing up the overall economy and prices.” A January report from the BOJ estimated that a 10% depreciation in the yen would push up Japan’s gross domestic product (GDP) by 1%3.
Japan’s energy sector to witness a shift to nuclear power
While much of the attention remains on the weaker Yen’s impact on exporters, it’s important to note that a weaker Yen also raises the costs of imports. Japan’s trade deficit widened to US$3.2Bn in March largely due to soaring energy costs. However, Russia’s war in Ukraine strengthens the case for Japan to shift its energy policy in favour of restarting nuclear power. During a speech in London on May 5, Prime Minister Fumio Kishida said that Japan would turn to its nuclear reactors to help reduce the country’s dependence on Russian fuel. He asserted Japan’s commitment to carbon neutrality by 2050 and the goal of reducing greenhouse gas emissions by 46% by 2030 while ensuring a stable energy supply.
Growth in Japanese dividends lure investors
Inflation has remained worryingly high in the US and Europe and surprisingly low in Japan. Owing to which, high dividend paying strategies have thrived in 2022. Interestingly, since the pandemic, Japanese dividends have grown more than major regions from the US to Europe and emerging markets. While European dividends have contracted more than 10%, Japanese dividends have grown almost 18%, measured in local currency terms. Given the conservative pay-out ratios of Japanese companies—which helped buffer dividend cuts in 2020—Japan tends to have a lower dividend yield than Europe, where dividend payments can be more cyclical.
Adopting a hedged Japanese exposure
Amidst rising geopolitical risks, Japanese equity markets performance have withstood the ensuing volatility better than most of its developed market peers in 2022 in local currency terms. However, when measured in foreign currency terms i.e., the US dollar or EUR terms the losses are magnified on the downside due to the weakness of the Yen (as shown below).
This goes to a point we often make - currency changes do not need to impact your foreign return, and you can target that local market return by hedging your currency risk. A hedged Japanese dividend paying equity exposure could enable an investor to hedge their exposure to the Yen. Valuations remain attractive both historically and compared to developed markets. US equity earnings multiples are trading at a 20% premium while Japan is priced at a 15% discount to its historical medium . The ensuing rotation from growth to value remains an attractive environment for value-oriented cyclical and industrial companies which are dominant in Japanese equity markets.
Sources
1 The Group of Ten or G10 is a group of 11 industrialized nations that have similar economic interests.
2 Bloomberg from 31 December 2021 to 11 May 2022.
3 “Outlook for Economic Activity and Price,” Bank of Japan, January 2022.
This material is prepared by WisdomTree and its affiliates and is not intended to be relied upon as a forecast, research or investment advice, and is not a recommendation, offer or solicitation to buy or sell any securities or to adopt any investment strategy. The opinions expressed are as of the date of production and may change as subsequent conditions vary. The information and opinions contained in this material are derived from proprietary and non-proprietary sources. As such, no warranty of accuracy or reliability is given and no responsibility arising in any other way for errors and omissions (including responsibility to any person by reason of negligence) is accepted by WisdomTree, nor any affiliate, nor any of their officers, employees or agents. Reliance upon information in this material is at the sole discretion of the reader. Past performance is not a reliable indicator of future performance.


long opportunities. Long Jpy indexMost of the indexes can bounce from here as they have been oversold. Just bought Jpy index this morning. Still a buy opportunity. Risk Reward 1:2. Possibility of higher reward, however I am happy with 2X.

✅NIKKEI225 WILL KEEP FALLING|SHORT🔥
✅NIKKEI225 is trading in a downtrend
And the price-action is rather bearish
The latest moves being a good proof of that
So I think that we will see the price go further down
Towards the support level below
SHORT🔥
✅Like and subscribe to never miss a new idea!✅
