USD/ILS 4H Chart: Review after new heightsAfter the US Dollar reached new heights against the Israeli Shekel, most patterns could be observed as broken. That fact pushed for a larger review.
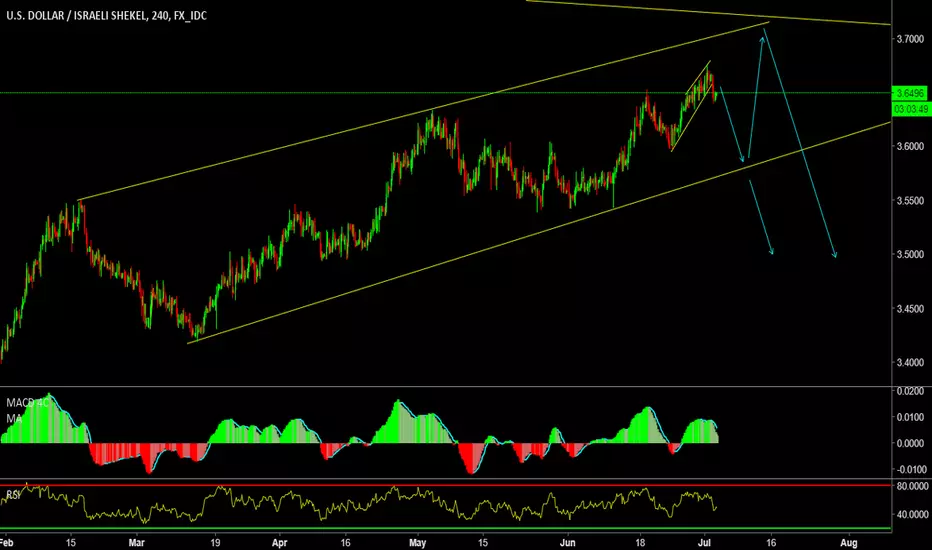
It was discovered that the currency exchange rate is surging simultaneously in two ascending pattern. The dominant pattern has the form of an ascending wedge. Meanwhile, there exists a junior medium term ascending channel pattern.
In regards to the future, the rate is likely going to reach the high level of the monthly PP near the 3.70 mark in July. However, note that there might be short term, smaller time frame resistance levels existing that might slow down the surge.
ILSUSD trade ideas


A PREDICTION TO MY LOCAL CURRENCYABCD PATERN WITH optional flag to 3.77 SL at 3.6 who seems to support


USD/ILS 1H Chart: Wedge continues to restrict pairThe prevailing pattern for the USD/ILS exchange rate is a six-week falling wedge. The rate entered this pattern from the downside on April 24. It has since provided two confirmations on each side and is gradually moving towards a breakout.
The bottom boundary of this pattern is reinforced by SMAs on the 4H and 1D time-frames. Thus, it is likely that the Greenback is pressured higher this week. The nearest upside target is the upper wedge line at 3.59. The strength of this area could push the rate back lower until a southern breakout occurs.
In case the 3.59 area surrenders, the US Dollar is expected to target the monthly R1 and its one-year high at 3.64.

head and shoulders as areversal pattern in a downtrend,uptrend cIt is possible that the right shoulder will fall to resistance at 3.54, or may continue to drop to 3.50.
Also the 3.50 levels are the bottom border of the ascending channel

USD/ILS 1H Chart: Senior channel dominates The US Dollar has strengthened against the Israeli Shekel since mid-March. This upward movement has allowed the rate to move from the bottom boundary of a senior channel up to its upper line and the monthly R1 near 3.6360.
The pair changed its sentiment during the previous trading weeks, thus falling down to 3.5770 mid-Monday. It seems that the following trading session or two might mark a reversal to the upside.
This movement, however, should not be long-lived, as the 200– and 100-hour SMAs and the 55-period SMA (on 4H chart) are located at 3.60. It is expected that the pair fails to overcome this mark and resumes its decline down to the senior channel in the 3.50/52 area.
In case the 3.60 mark is breached, traders should see a further surge up to the medium-term channel and the nine-month high of 3.64.

head and shoulders as areversal pattern in a downtrend It is possible to be in front of forming a head and shoulders pattern, so I think the price will take a bearish path to form the right shoulder before trying to climb


usd \ ils I think the price will make higher high ,, But We should monitor the price at the resistance level


usdilsB from X to A .236 - .382
C from A to B 1.13
D from B to C 2
D from X to A .886
So I think we will in short position at least until 3.44 at .618% fib


head and shoulderit my be back to retest the neak line for head and shoulder then make move up ,,,, we need break 3.5485 to be sure rise the price
