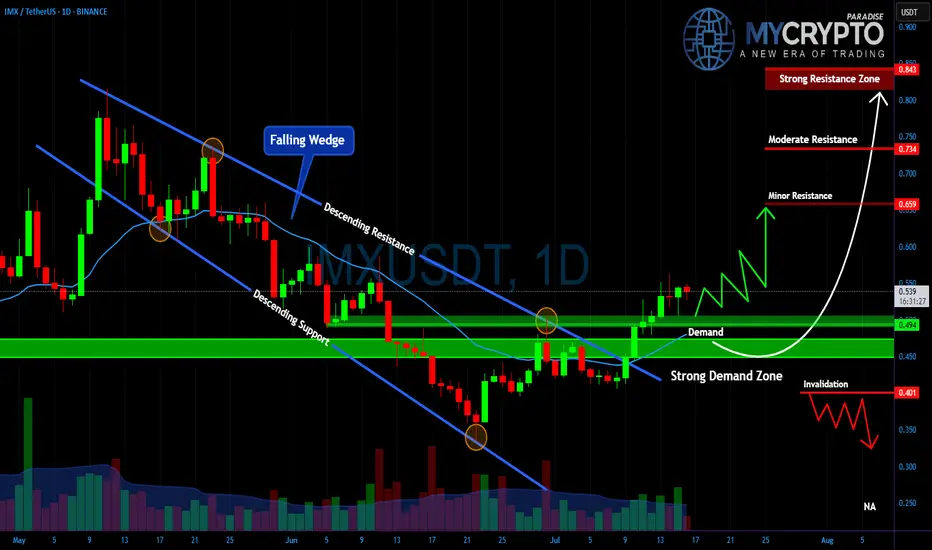
IMXUSDT – Major Breakout or Another Painful Trap Ahead?Yello Paradisers, is this the real start of a powerful bullish reversal on #IMX, or just another classic setup to liquidate impatient traders before the true move begins? The next few days will decide everything.
💎#IMXUSDT has broken out of a falling wedge, which is a typical bullish reversal structure, and is now retesting the strong demand zone between $0.45 and $0.49. As long as the price holds above this level, the bullish scenario remains intact, with $0.659 as the first key resistance to watch.
💎A clean break above $0.659 could open the way toward $0.734, while the critical resistance zone at $0.843 will be the ultimate test of whether IMX can shift into a sustained uptrend.
💎However, the invalidation level sits at $0.401. If this level fails, expect a fast move back toward $0.30, which will likely wipe out many traders who jumped in too early.
This is exactly where most retail traders get trapped. They either chase the move too late or panic-sell too early.
MyCryptoParadise
iFeel the success🌴
IMXUSDT trade ideas
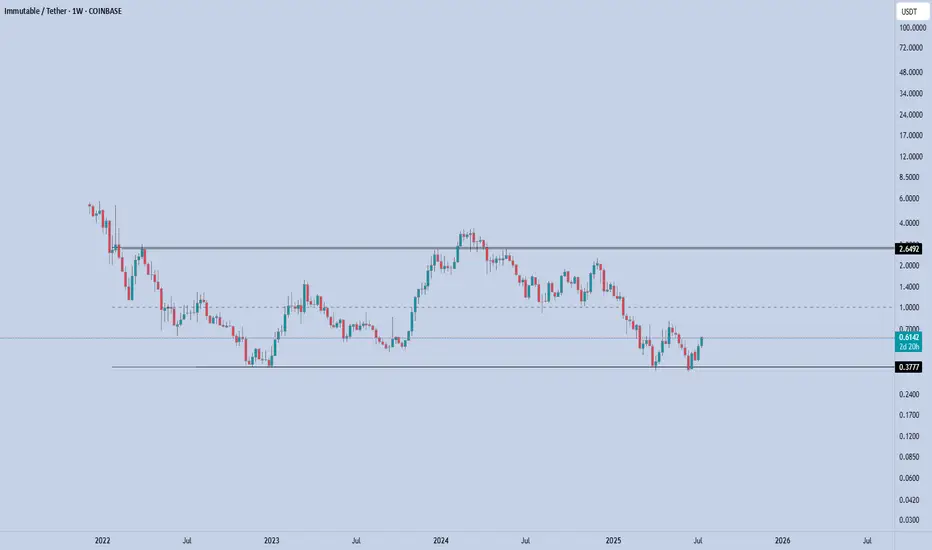
IMX – Range Low ReclaimedIMX has once again defended the $0.37–0.38 demand zone, bouncing sharply off the lows. This level has acted as a long-term accumulation base since late 2022, and price is now showing early signs of another range rotation.
Currently trading at $0.61, IMX is holding above the reclaimed support. As long as this level is maintained, the setup favors a move toward the mid-range and potentially the upper boundary of the established range.
🎯 Key Levels:
Support: $0.38 (range low & invalidation)
Mid-range: $1
Target: $2.65 (range high)
If bulls can push through the $1 mid-range resistance, the top of the range at $2.65 becomes the next magnet.
📌 Risk Management:
$0.38 is the line in the sand. A close below this level breaks the structure and invalidates the setup.
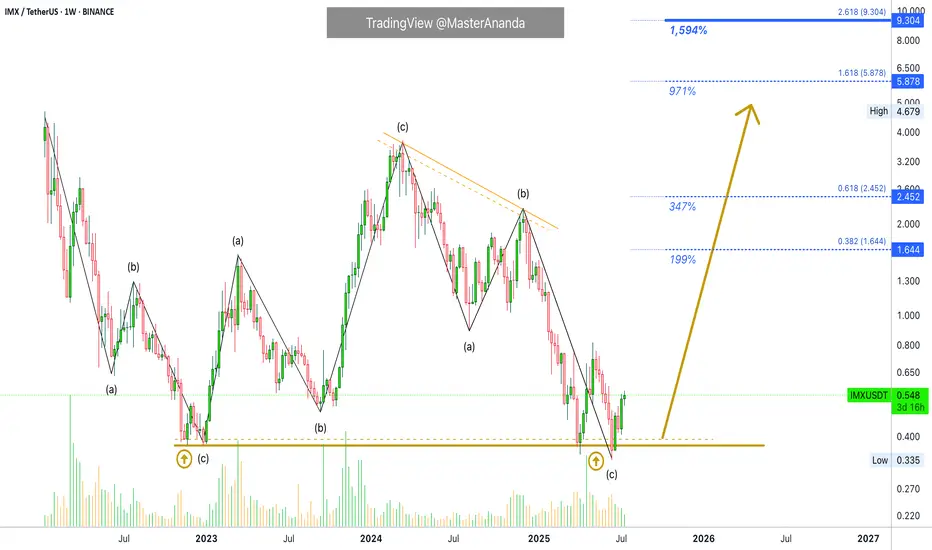
A New All-Time High Guaranteed for ImmutableX (1,600% PP)IMX produced a strong bullish cycle between December 2022 and March 2024. The entire bullish wave was corrected beyond 100%. This means that IMXUSDT hit a lower low. It went below the starting point of the last bullish wave. This is good in several ways.
The last move being deleted in its entirety opens the doors for a new bullish cycle with unlimited growth potential. We also know that all weak hands have been removed. Anybody who wanted to sell had more than a year to do so with all profits erased from the previous cycle. A total flush, a full reset.
The last bullish cycle produced more than 850%. We now know that this much is do-able so it becomes very easy. Last time market conditions were mixed to say the least, but not extremely bullish nor the best possible.
If IMXUSDT can grew this much in a mixed market, how much can it grow in a favorable market, in a bull market?
So, we aim for a strong higher high, a new all-time high. This opens up $5.9 an $9.3 as target for this newly developing bullish phase.
Thank you for reading.
Namaste.
IMXUSDT 1D#IMX has broken above both the descending trendline and the Ichimoku Cloud on the daily chart — a strong bullish signal.
However, with RSI in the overbought zone and price nearing the daily SMA200, a rejection or short-term pullback is likely. A correction toward the $0.581–$0.559 range could offer a better entry.
💡 Consider placing buy orders in portions within that zone.
If IMX successfully breaks above the SMA200, the next targets will be:
🎯 $0.732
🎯 $0.826
🎯 $0.959
🎯 $1.129
⚠️ Always use a tight stop-loss and practice proper risk management.

Next big target for IMX is 3$. IMX is setting its sights on the next big target at $3. It's currently trading within a large channel and showing a weekly hidden bullish divergence—an encouraging sign for upward continuation. A potential double bottom is forming, with the neckline around $0.71. If that breaks, the initial projection is around $1.50, with $3 as the eventual target.
However, $3 is a major resistance level, so the road up won’t be easy. Still, the structure looks bullish in the long term. Now it's a matter of watching how price action unfolds in the coming weeks.

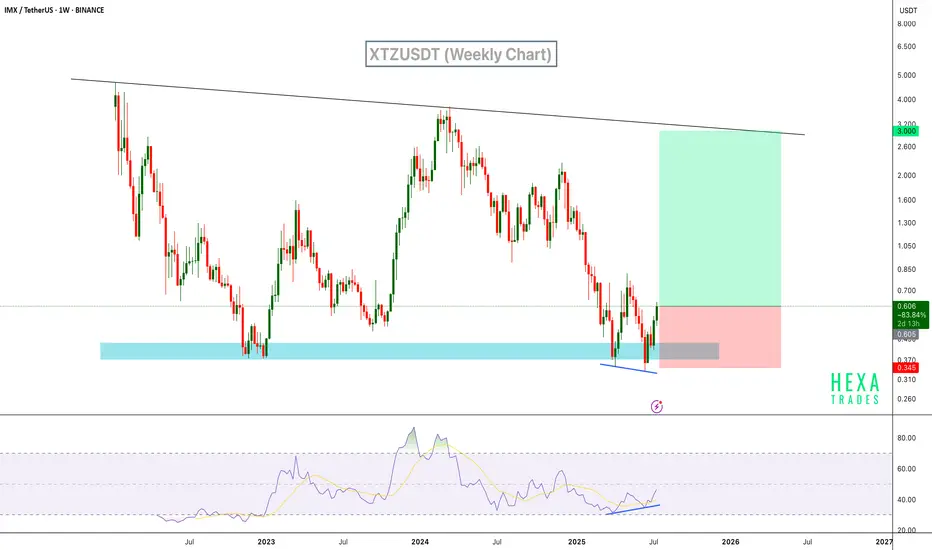
IMX Signals Reversal with RSI Bullish DivergenceIMX has shown a strong bounce from a demand zone, backed by clear bullish divergence on the RSI. Price printed a higher low on the oscillator while price action formed a lower low – a classic reversal signal. This area has acted as support multiple times in the past, and we can expect a reversal from the current support level.
Resistance 1:
Resistance 2:
Resistance 2:
Cheers
Hexa
BINANCE:IMXUSDT CRYPTO:IMXUSD
IMX — Double Bottom & Weekly RSI Div1. Buy sweep of all-time low, spot weekly RSI divergence
2. Entry: Confirm double bottom or strong bounce
3. Main target: $0.81+ (super bullish if break/hold above)
4. Stop: Below all-time low — scenario invalid

IMX IDEA FOR 2025🔥 SEED_DONKEYDAN_MARKET_CAP:IMX long setup (1 W) 🚀
✅ Entry Zone: $0.35 – $0.31 (multi-year demand)
🎯 Targets
• TP-1: $0.94 (Aug-23 supply)
• TP-2: $1.40 (Mar-24 breakdown)
⛔ Stop-Loss
Weekly close < $0.27
📊 Thesis
• #Immutable zkEVM mainnet live; Immutable X to merge → single Superchain 🛠️
• Staking rewards + IMX Trading Rewards hit #zkEVM 19 June 🎁
• Ubisoft, Guns of the Future & >200 games building on Immutable 🤖🎮
• #Passport racing toward 1 M wallets; gas-free in-game tx 👛
• Guild of Guardians & Hunters On-Chain already live – first AAA #Web3 hits
• Vesting cliff 93 % past; emissions halve again Q1-26 🔒

IMXUSDT 6D AnalysisIMX ~ 6D Analysis
#IMX This is the lowest support block for now. Buy if you still have faith in this coin with a short term target of at least 20%+ from this support

$IMXUSDT looks bullishSEED_DONKEYDAN_MARKET_CAP:IMX looks bullish on the daily chart after a clean breakout and retest of the $0.595 support.
Price is holding above the trendline and 100MA, signalling strength.
If momentum continues, the next target is around $1.03.
DYOR, NFA.

IMX/USDT Analysis. Short Setup
This coin has just tested the volume anomaly zone at $0.72–$0.735 and is already showing an initial reaction. We are considering an intraday short, at least toward the local low (marked with a yellow line).
This publication is not financial advice.

IMX retesting inverse head and shoulders breakout lineIMX is currently retesting the inverse head and shoulders pattern. If we bounce off here we can see a bullish move to the upside. Gaming tokens haven't really taken off yet compared to memes and the big dogs such as BTC and ETH.

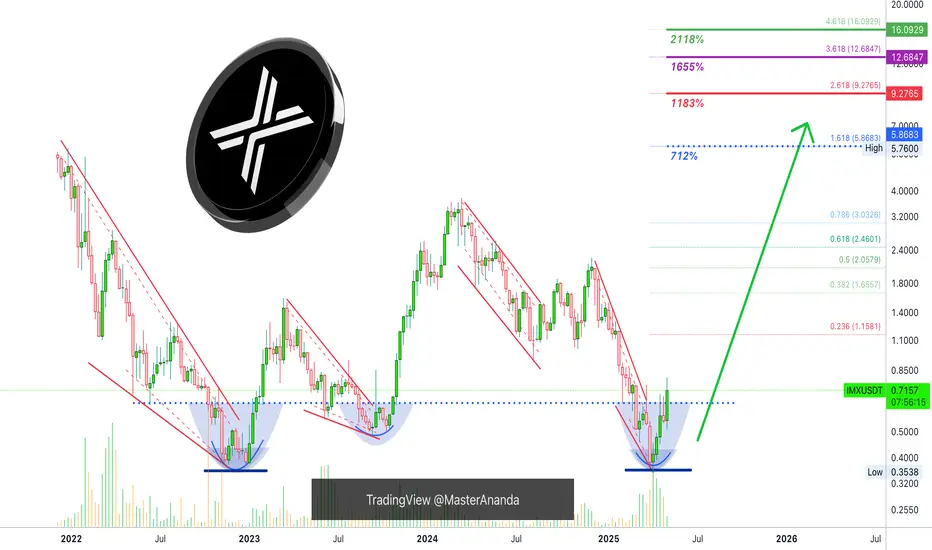
Immutable Long-Term Support Established (New 3000% Wave Starts)Here we have the establishment and confirmation of a long-term support and double-bottom. IMXUSDT activated in April 2025 the same level and low as back in November 2022.
From November 2022 through March 2024 IMX went bullish. This bullish cycle produced 900% total growth (10X).
From March 2024 through April 2025 IMX went bearish. This bearish period removed all gains from the previous bullish cycle. A complete reset.
Now IMXUSDT is back to zero and anything is possible. This project can grow 1,655% as shown on the chart just as it can grow 3,000% or even 10,000%.
The reason why I cannot make a more accurate prediction about the next All-Time High is because there is not enough chart data. Immutable was not present in the last bull market so we don't know how this pair is likely to behave in a similar cycle.
900% growth is quite decent in the transition/recovery year, so I wouldn't be surprised to see at the minimum 2,000% to 3,000% growth in the coming months. Can be more, can be less, but it will grow.
Looking closer, in the last three months IMXUSDT produced a classic rounded bottom pattern. This week, the action is moving back above the baseline; the bullish zone.
This weekly session closes in just a few hours. Once the week closes above the blue dotted line, this signal is fully confirmed. The same signal from early 2023. This clearly shows what I've been saying, we will have a bull market now, in 2025. Prepare for long-term growth.
Namaste.
Over 140% profit with IMX (3D)IMX appears to be in a large wave B, which is forming a triangle. It is currently at the end of wave d of B.
It is expected that upon touching the green zone, wave e of B will begin, pushing the price into a bullish phase.
We are looking for buy/long positions in the green zone.
A weekly candle closing below the invalidation level will invalidate this analysis.
For risk management, please don't forget stop loss and capital management
When we reach the first target, save some profit and then change the stop to entry
Comment if you have any questions
Thank You

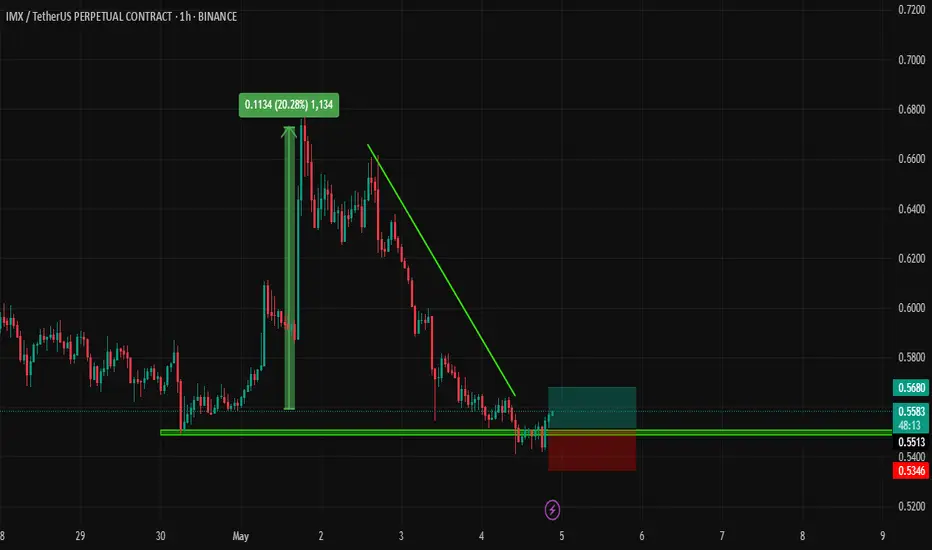
IMX - Is it a movie?IMX Looks like a structure is broken for everyone to watch, but the stances is as shown below!!!!!! We can see that the price was building value comfortably above $0.63–$0.65 until May 2nd. Then, a strong selling move broke below that range, followed by a new value area formation below $0.59, showing that sellers are in control and the market is accepting these lower prices. The latest session has POC, VAH, and VAL tightly compressed near $0.563, which means extremely low volatility and a potential setup for the next expansion.
But what i suggest is this, will take a last breather or just go to the next block marked as orange, can have dead cat bounces!!

IMXUSDT Forming Inverse Head and Shoulder
IMXUSDT is currently showcasing one of the most reliable bullish reversal patterns on the charts – the inverse head and shoulders. This formation typically signals a shift from a bearish to a bullish trend, and with the neckline nearing a potential breakout point, this setup is becoming increasingly attractive. The current price action reflects a strong bounce from a key support level, aligning perfectly with the right shoulder of the pattern.
Volume has started to rise significantly during this bounce, which further validates the possibility of a confirmed breakout once the neckline is breached. Such volume activity typically precedes large price movements, especially when it coincides with technical patterns like this. Traders and investors are beginning to recognize this potential and are showing renewed interest in IMX.
With an expected gain of 150% to 160% from current levels, this setup could be one of the most explosive moves in the altcoin space. The pattern targets suggest a move toward previous highs, making IMXUSDT a strong candidate for mid-term bullish trades. The broader market sentiment also supports altcoin rallies, adding fuel to the bullish thesis for this coin.
✅ Show your support by hitting the like button and
✅ Leaving a comment below! (What is You opinion about this Coin)
Your feedback and engagement keep me inspired to share more insightful market analysis with you!


IMX - LONG HOLD The chart tells its own story. Analyzing IMX/USDT on the 1D timeframe, I see strong potential for a long position. The price has broken out of a descending wedge pattern — a classic bullish signal. Current structure shows early signs of a reversal from the bottom zone.
We’ve already seen a bounce from the lower trendline, and with increased volume, there’s momentum building for a potential move up.
Let’s see how it plays out — looks like a clean setup for a solid hold.

#IMX/USDT#IMX
The price is moving within a descending channel on the 1-hour frame, adhering well to it, and is heading for a strong breakout and retest.
We are seeing a bounce from the lower boundary of the descending channel, which is support at 0.599.
We have a downtrend on the RSI indicator that is about to be broken and retested, supporting the upward trend.
We are looking for stability above the 100 moving average.
Entry price: 0.602
First target: 0.649
Second target: 0.682
Third target: 0.721

IMX | Trend Is Your FriendTrend is your friend
Expecting massive bullish rally on hourly timeframe✅
Expected 15% bullish wave in coming days🎯🚀

#IMX/USDT#IMX
The price is moving within a descending channel on the 1-hour frame, adhering well to it, and is heading for a strong breakout and retest.
We are seeing a bounce from the lower boundary of the descending channel, which is support at 0.390
We have a downtrend on the RSI indicator that is about to be broken and retested, supporting the upward trend.
We are looking for stability above the 100 moving average.
Entry price: 0.407
First target: 0.426
Second target: 0.449
Third target: 0.480

LongBuy in part thirty percent,drop ten percent,buy more ,let say 30 percent and if it drop more load thirty percent
