IMX/USDT 35% down from our entry... Congrats #IMX has hit our targets!
Our short call resulted in a 35% profit from entry
I've closed my position and waiting for a potential reversal.
If support holds, we could see an upward move. Otherwise, our next target is $0.88.
Remember to always wait for good confirmations before opening a trade.
Happy trading!
#cryptotrading #technicalanalysis #IMXUSDT #crypto #alts #Altcoins #binance #Profit
IMXUSDT trade ideas

Imx Getting ready for bullish Impulse Formed Falling Wedge In h1 Incase Of breakout expecting 20 to 25% bullish move
keep eyes on imx for breakout

IMX USDT Short position.There is divergence on this chart, and I also expect a correction on BTC to push IMX down to the target.

IMX FOR A GOOD LONG ?Hello guys , Imx is doing a great job and I can see an ideal pattern of deep crap here , target near 1.85 , share me your ideas in comments and thanks a lot

IMXUSDT to head for next resistance around 1.28-1.30The price has hit twice the daily support since we took the last trade when the price hit for the first time. I believe this is also a good opportunity for a long here.

IMXUSDT soon to hit daily support and likely to bounce thereThe price is heading towards daily support zone DS1. It is likely that the price will bounce from this support zone if price hits this zone. Let take a long once price reaches there and target 1.28-1.30 area.

Failed Inverted Head and Shoulders pattern on Immutable(IMX)!!!Immutable has been moving between two 🔴resistance($1.3-$1.8)🔴 and 🟢support zones🟢 for about a year.
Also, Immutable failed to execute the Inverted Head and Shoulders Pattern correctly, and it seems that the resistance zone break was accompanied by a 🐻bull trap🐻.
I expect Immutable to go down again to the 🟢support zone($0.78-$0.$0.63)🟢.
Immutable Analyze ( IMXUSDT ), Daily time frame ⏰.
Do not forget to put Stop loss for your positions (For every position you want to open).
Please follow your strategy, this is just my Idea, and I will be glad to see your ideas in this post.
Please do not forget the ✅' like '✅ button 🙏😊 & Share it with your friends; thanks, and Trade safe.

IMX/USDT 60% Profit in My Short PositionsDear traders,
We bring you an update on the IMX/USDT pairing. As of today, IMX is trading at $1.22, with a recent low of $1.145. Our team provided a chart analysis earlier, suggesting that the price was at its peak and that it was advisable to sell or short. We're pleased to inform you that our prediction has been accurate, and we have booked a substantial profit from the short sale, which we shared with our channel members.
As of now, we believe that there is still potential for a further downside move, and we anticipate that IMX may test the 0.618 fib retracement level, which is approximately $1.0. We have opened a short position and have also booked considerable profit on it.
We are thrilled to share our analysis with you and hope that it has been useful. Please like, share, and follow us for more updates. Thank you for your continued support.
Best regards,

IMX forming a bullish pennant
IMX was amongs cryptos with the best performances these weekends.
It's now in consolidation phase. A bullish pennant is formed. In my opinion, it could reach +25% target (from the current price) with two possible scenarios as depicted in chart.

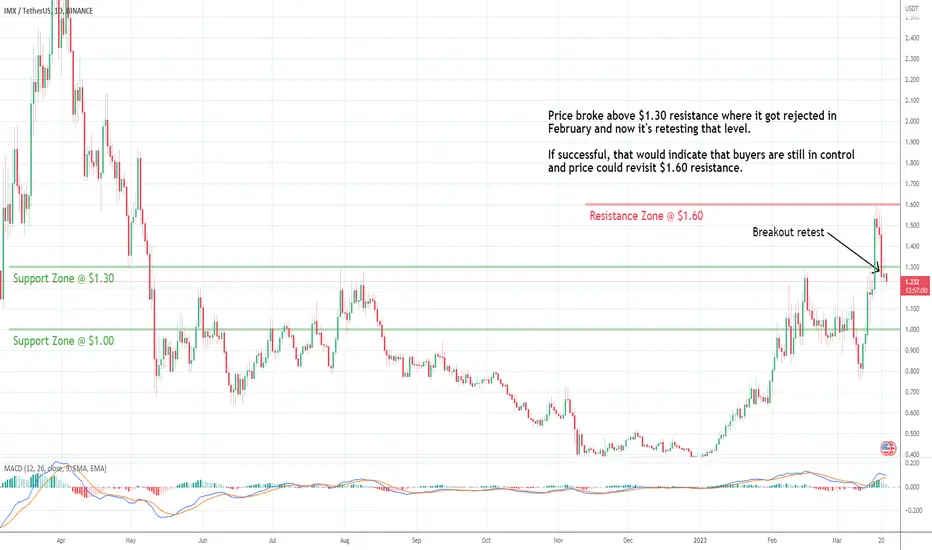
IMX: Pullback in UptrendTrade setup: Price broke above $1.30 resistance where it got rejected in February and now it’s retesting that level. If successful, that would indicate that buyers are still in control and price could revisit $1.60 resistance.
Trend: Uptrend across all time horizons (Short- Medium- and Long-Term).
Momentum is Bullish but inflecting. MACD Line is above MACD Signal Line and RSI is above 55 but momentum may have peaked since MACD Histogram bars are declining, which suggests that momentum is weakening.
Support and Resistance: Nearest Support Zone is $1.30 (previous resistance), then $1.00. The nearest Resistance Zone is $1.60.
IMX ANALYSIS (30M)Hi, dear traders. how are you ? Today we have a viewpoint to SELL/BUY the IMX symbol.
For risk management, please don't forget stop loss and capital management
When we reach the first target, save some profit and then change the stop to entry
Comment if you have any questions
Thank You

IMXthe bearish movemenet continue with this, currently price is ranging in lower tf. a little bit push for reentry, or price break the support and sell continue. we canalways wait for buy entry if missed the re-entry

IMXUSDT trading around 4h support, soon to decide directionSo here is an update for IMXUSDT. The price is currently trading just above 4h support zone 4HS1 marked on the chart. Till this support holds, it is likely that price will aim towards the next resistance around 1.734 as marked on the chart with horizontal line. In case it loses this 4h support, the price will likely head towards the daily support DS1.


New idea for $IMX 1. Rollback after growth under $BTC rollback.
2. The uptrend line has been broken.
3. Buyers on the MACD show weakness at 4h and 1h.
4. Multiple divergences on 4h and 1h.
5. Local short position.
6. Don't forget about your risk management!

IMX : TRADING TARGETFor day trading IMX shows an interesting view since today.
We will follow it coming time.
The target for this chart is $0.789
This update is made with instant volume follow trend view, and depending on live day trading.

IMXUSDT 1D
IMX had a great pump recently and it seems it could keep going UP with a proper pullback 🤔
Two buy zones have been highlighted for your comfort but you have to apply proper risk management 👌🏻✅

Technical and Fundamental Analysis of IMX/USDTTechnical and Fundamental Analysis of IMX/USDT:
IMX has shown impressive gains of 109% in just 8 days, making it an attractive investment option for traders. However, a comprehensive analysis is necessary to make informed decisions while trading IMX/USDT.
Technical Analysis:
According to the chart analysis, there is a likelihood of some retracement from the current levels. The immediate target price for IMX/USDT is expected to be $1.10. The 0.50 Fib level also coincides with this target price, making it a significant resistance level.
Based on these factors, there is a high chance that the price may test the $1 level in the near future. Therefore, traders are advised to keep a close watch on the price movements to avoid any losses.
Fundamental Analysis:
The current market capitalization of IMX stands at $1.29B, with a circulating supply of 868,583,515 IMX tokens. The maximum supply of IMX tokens is 2,000,000,000 IMX. These figures indicate that the market is relatively small, which can lead to significant price fluctuations in response to any news or developments.
Furthermore, the next token unlock is scheduled to take place on 25 March 2023, in just 6 days. This event is expected to cause some volatility in the market, which can lead to a price drop of 10% to 30% from the current levels. The token unlock will release 18,075,990 IMX tokens, which are valued at $26.75M.
Conclusion:
In conclusion, while IMX/USDT has shown promising gains, traders should be cautious and keep a close watch on the price movements, particularly with the next token unlock just around the corner. The technical analysis indicates a potential retracement, with $1.10 being the immediate target price. The fundamental analysis suggests that the market is relatively small, and any significant event or development can cause considerable price fluctuations. Therefore, traders should make informed decisions and practice safe trading practices to avoid any potential losses.

IMX/USDT Main trend (part)Logarithm. Time frame 3 days. The main trend (part).
The idea shows the true highs of pumping $9.3172.
From the peak, the price has dropped by -95% (acceptable for such altcoin HYIPs). Minimum $0.376.
The price is now $0.72 after working off double bottom targets.
The price has gone to an important mirror resistance.
Schematically, conventionally, showed the potential movement.
It is also worth noting that this cryptocurrency is associated with a gaming HYIP, hence, in addition to the market cycle, the price is significantly affected by the real application of this protocol in the gaming industry.
ICO — $0.16.
It is worth noting that the ICO took place in November 2021. Price $0.16.
This is what the trend looks like on the line chart.

IMX/USDTTARGET 2.5 (84% PROFIT)
all timeframes are bullish, from monthly, weekly, down to daily.
We had a a break above the neckline so its only expected that we climb higher

IMX TO $2 + (HEAD AND SHOULDERS)Bullish on IMX, Lots of partnership news and H&S pattern .
What do you think

RLinda ! IMXUSDT-> The bulls are pulling aheadIMXUSDT is bursting ahead as bitcoin and the entire market strengthens. A false moving average breakout forms a liquidity grab and positive potential formation.
Price breaks through the 1.189 level and the strong downward resistance line. If the price successfully consolidates above the support level, the coin can shoot towards 1.1800 and reach the target fairly quickly. There is a void ahead. The odds are high.
I expect the bulls to be able to hold above the 1.189 level, in which case I will stick to the bullish potential in the medium term. My targets are 1.1800, 2.200
Regards to R. Linda!

IMX : PRICE TARGET $0,79 THE NEXT 48% BREAKOUTDepending on our study IMX is able to break out 48% coming time.
This study was done with some of the confirmations views for IMX.
On side of algorithmic trading, IMX also shows a breakout effect.
OUR TARGET FOR IMX = $0,789 what makes it around $0,79
There is high chance that IMX will be the next breakout coin
We have used the same algorithmic trading that we did use for OCEAN.
