000002 trade ideas


uptrend for shanghai A indexuptrend for shanghai A index.
it wont go up faster, but the it broke up the resistance, uptrend now.
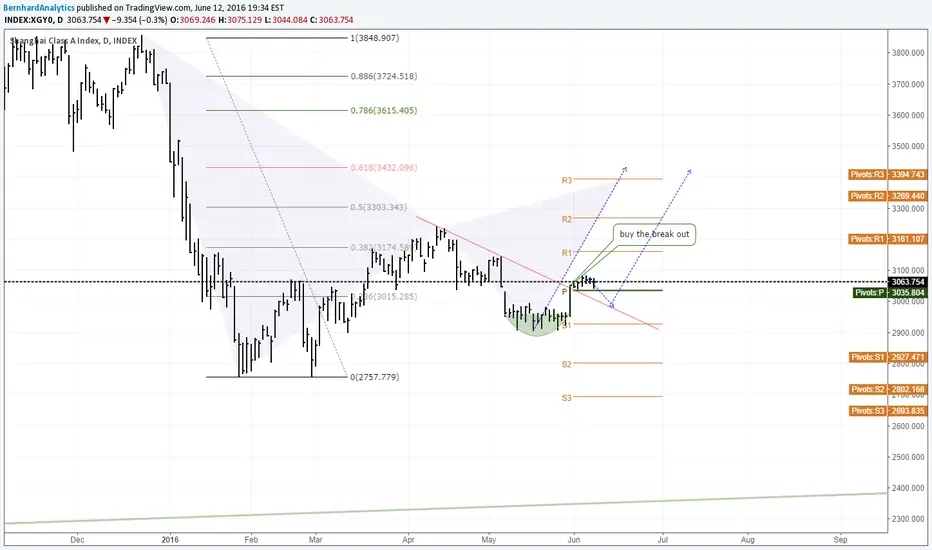

Sign to go longXGY0 breaks out of the weekly bearish line. It is a strong sign to go long. For the whole elliott wave analysis, please check my previous analysis chart below.
Good luck for everyone!

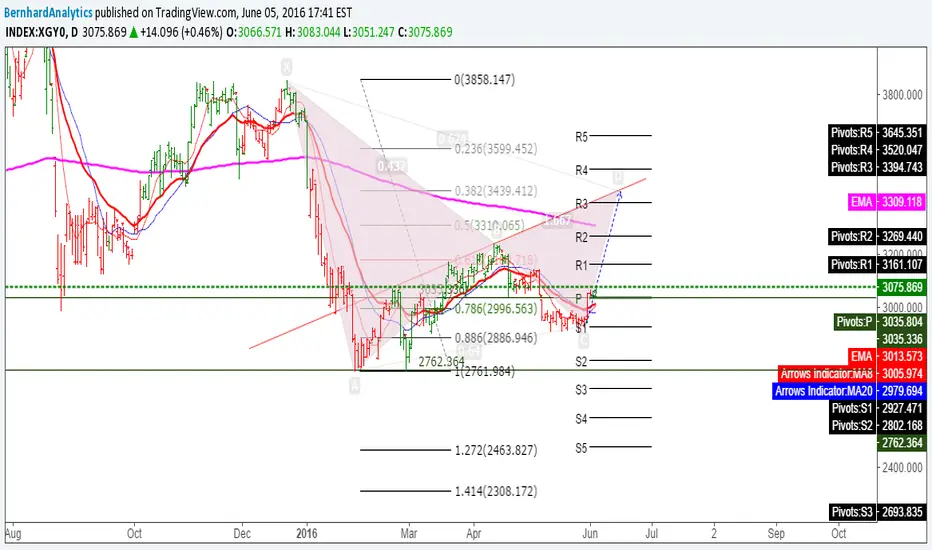
XGYO Bearish Butterfly Completedbearish butterfly completed
SL:3175
TP1:3013
TP2:2917
TP3:2761
INDEX:XGY0


China's stock market can resurgence again? I'm all positions, HoChina's stock market can resurgence again? I'm all positions, How about you?


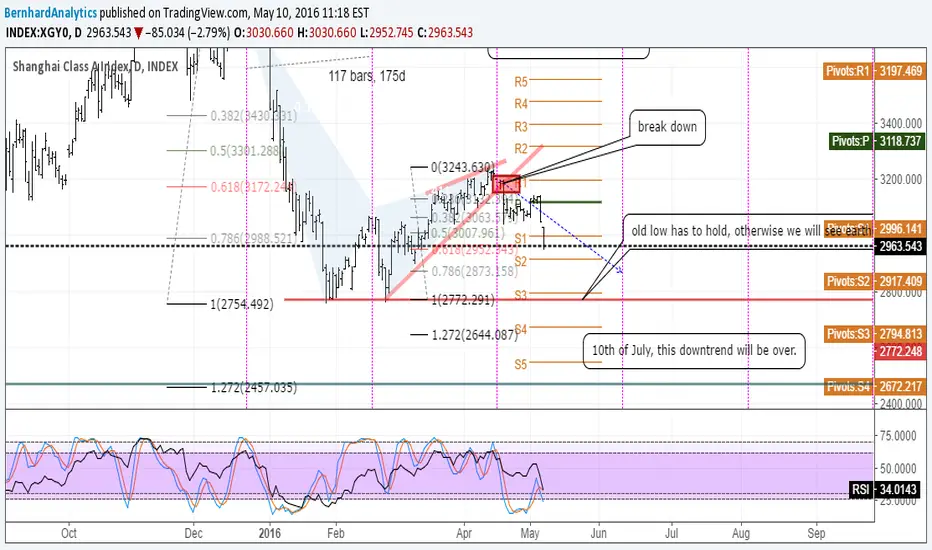
10th of July, downtrend will be over for shanghai A index.10th of July, downtrend will be over for shanghai A index.
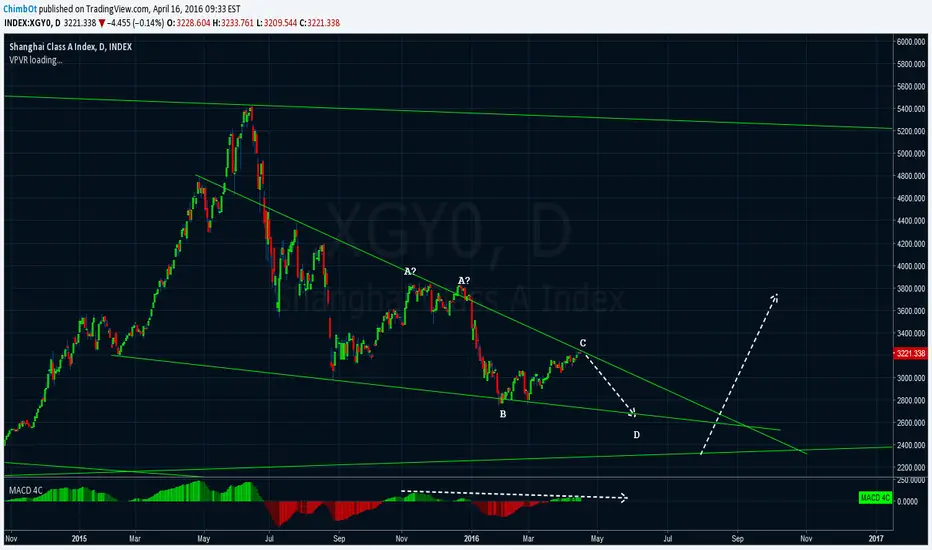
Elliott wave analysis on Shanghai Class A Index (2016-04-24)Shanghai class A index is coming to a resistance level at around 3166~3280. It also meets a resistance from the bearish trend line.
From EW analysis the previous ABC correction might be part of the DIAGONAL TRIANGLES. It will be a good opportunity to go long after the wave E is finished which might go back to 2650~2750. After finishing the wave E, it might bounce up to 3738 and higher.
Good luck for everyone!
Notes: If it breaks the bearish trend line, the diagonal triangle will be invalid. It will be safe to join the long which might continue going up to 3738 and higher.

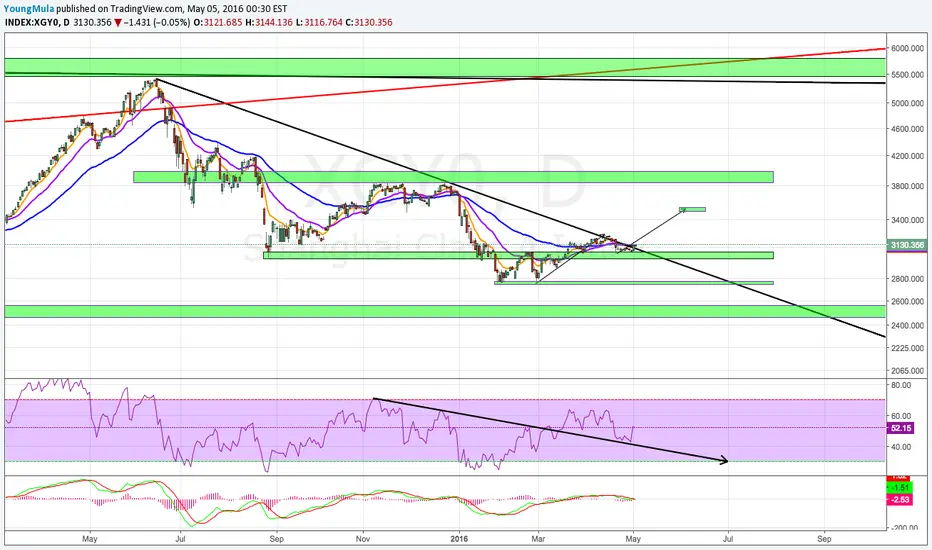
Shanghai Class A index: Bulls losing steamThe Shanghai Class A index is showing some bearish signals at the moment.
Even then, there's still a chance to resume the daily uptrend if price marches back up above the recent 12 bar price level at 3140.86.
Ideally, we'd see a loss of bearish momentum in the next 3 bars, and then a breakout to the upside firmly closing above 3232.329 ideally, as the first precedent for higher lows.
On the other hand, to confirm bearish momentum, we'd need to see 2966.49 within the next 3 bars.
If long chinese equities, you'd consider closing partially, selling calls, moving stops in profit, to protect your profits (if any).
Sentiment has been extremely negative for equities this week, reaching a peak on Friday, so I assume a contrarian stance and expect higher highs soon, before any real correction starts.
invst.ly - A50 chart (looks more bullish, a close above 9657.5 might anticipate a strong 12.91% rally to 10880 in 2 weeks.
If interested in my trading signals, or in personal tuition, contact me privately. I'm offering a considerable discount on a packaged course which includes access to my private trading signals list for a year.
Cheers,
Ivan Labrie.


Shanghai Index | Same pattern as JanBounce or die. Seems consolidating as did in the past. Take care.
Happy trading.


Shanghai Stock Index one more downside (Nikita FX )Shanghai Stock Class-A Index will have one more downside wave-E because of
descending triangle consolidation type.
Green Gap Line & Pink ascending trend Line would be strong Support near the
Triangle Crossing Point.
This shows only wave image.......SHORT for short-term, and LONG for long-term
Nikita FX (climbingfx.jugem.jp )
