Shanghai Monthly Drop in PerspectiveSeeing this is all over the news and the doom and gloomers are coming out in force (after the fact... of course!)
I thought I would step back to the higher time frames to see where we are...
Interestingly we dropped almost perfectly off the high at the completion of an 8 year gartley pattern
Looking at the chart now, there is really nothing stopping this falling further till we get to around 3365 where there is a confluence of a long term support and resistance line + a demand level + a 61.8% retracement
This would imply a high to low of around 37%, but in context to the last years rally it would still be considered around a 'normal' retracement of 38.2%, therefore I see the confluence zone as a potential area to look for longs and in the mean time look to sell rallies
Keep it simple, ignore the headline news as they are reporters or economists with no money on the line
I.e. not traders...! think like a trader, keep risk low and stack the odds in your favour
000002 trade ideas

No halt of chinese stock market plunge"In an attempt to halt the slide, China has arranged a curb on new share issues and orchestrated brokerages and fund managers to buy massive amounts of stocks, helped by China’s state-backed margin finance company, which in turn has a direct line of liquidity from the central bank." -The Guardian

The Shanghai Peak Is Lower than 2008, But Its Drop Much FasterThis most recent Shanghai Composite peak has capped out much lower than what we had seen in 2008, and its retreat is proving more explosive. The four-week ATR here has hit a record and the standard 14-day is way beyond that previous peak.
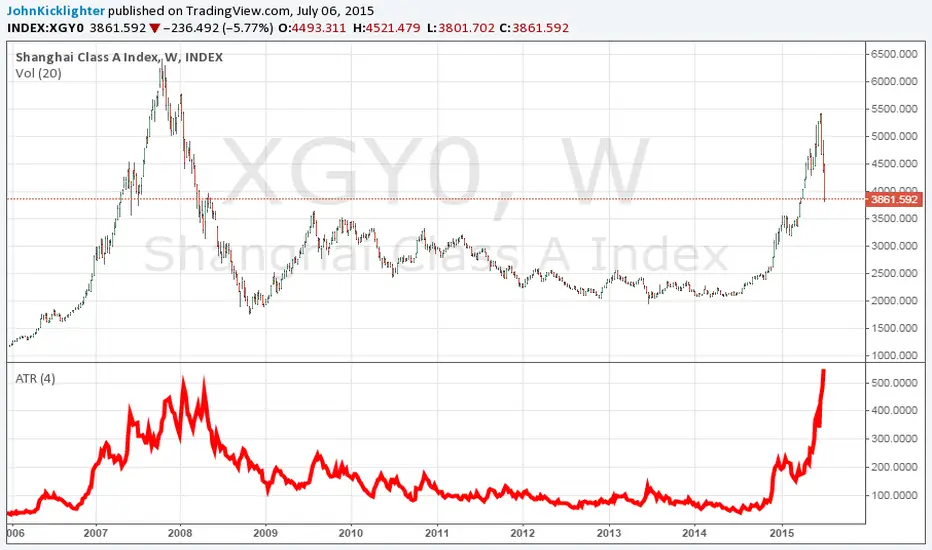
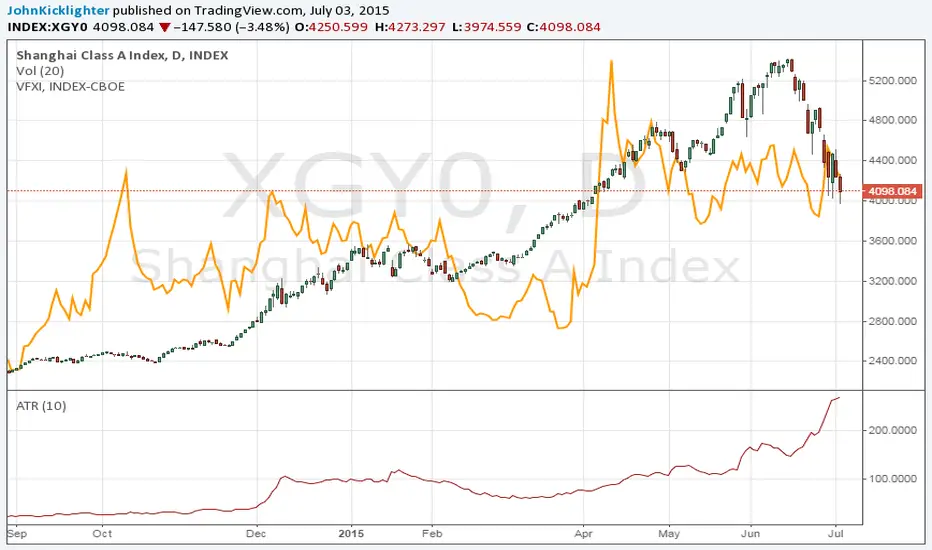
Chinese Equities Collapsing, Simplest Volatility Measure BestThe CBOE's China Volatility Index seems to be concentrated on an area of the market that seems to miss the big picture. I think I will go with the ol' reliable ATR. The 10-day ATR on the Shanghai Composite has jumped to 310 - handily outpacing the 2008 peak of around 225.
align wave count with RSI, bull market almost finishThis time I count the wave by comparing historic RSI. details on chart.

China's High Flying Rally Faces a Serious Crisis of ConfidenceThe Shanghai Composite - the best performing equity index this year and the past few years cumulatively - suffered a painful loss this past week. It is so far only 48 hours of trouble, but can a market built on exuberant speculation stand up to crises of confidence?

Extended 5th Wave in Rally Nearly CompleteSince February, the Shanghai "A" Shares could be viewed as having developed an extended 5th wave which could complete the present rally soon. (The "B" Shares index, by comparison, appears to be in the final stage of an upward post-triangle thrust rally with still a bit further to go. )
Once the extended 5th wave is complete, it would be reasonable to expect the following correction to be sharp and swift, looking for support at the bottom of the wave "2" of the 5th wave itself at the 3351 level.

XGY0 - compare now and 2007 - 5/21/2015If we have a similar move to 2007, China bull market has 7 months left for 114% gain. We can play this by using ASHR ETF. Note nothing is given so play safe.

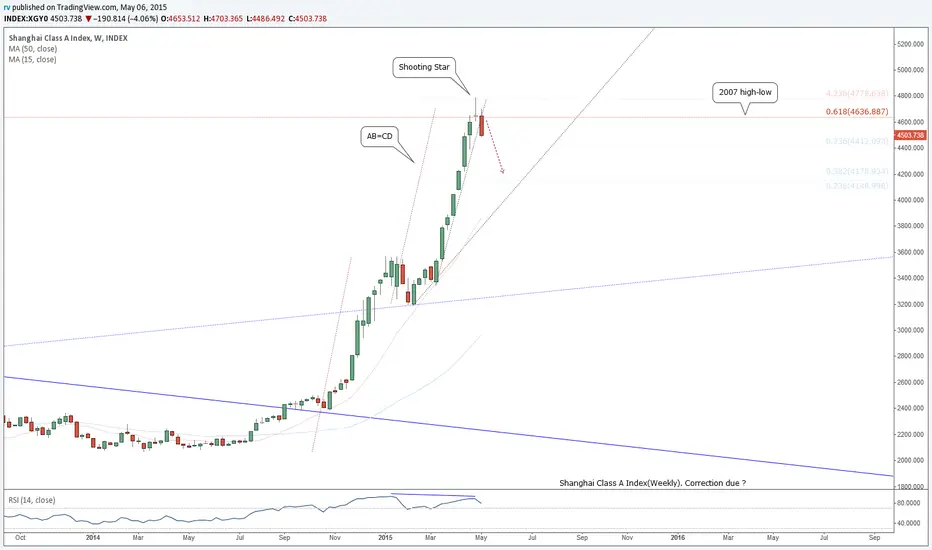
Shanghai Class A Index(Weekly). Correction due ?Correction and some consolidation possible.
AB=CD.
Parabolic daily uptrend_line break_out.
Shooting Star and lower close bar.
61.8% retracement 2007 high-low.
4.236 fib extension.
Slight divergence on RSI. Daily MACD Cross_Over
Shanghai Class A Shares - Alternate CountI can adjust my outlook for the Shanghai A Shares index when applying the "Kennedy Channeling Technique" (devised by Jeffrey Kennedy of Elliott Wave International).
It suggests that the 4th wave of an impulse would fall below the lower trendline of the "Acceleration Channel" before it would be complete. When counting waves (1) and (2) of C(circle) of B as shown in the chart, and drawing the channel from their extremes (using the assumed top of wave (3) as the channel's top coordinate) the 4th wave-looking correction between December and March did not fall below the channel. It did fall below a more narrow channel made from an assumed later-occurring smaller degree 1st and 2nd wave, which leads me to suspect that the index is just hitting it's wave (3) now and will decline in wave (4) to below this channel (perhaps to .236 or .382 of wave (3), where the red box is) before rising again in a wave (5) at least slightly above this wave (3) to complete "C" (circle) of B of IV.
When wave (4) develops, its parameters could provide the guidelines for drawing the descending "Deceleration Channel" which would be useful in determining where wave (5) begins.

Shanghai Class A Index Peaking at a .618 Retracement?I notice that the Shanghai Class A Shares Index is just hitting the .618 Fibonacci retracement of the major decline from the 2007 peak to the 2008 low, and this rocketing price movement has culminated in five waves in a textbook impulsive structure that began in June 2013.
I wonder if price will now correct downward significantly. Recently, before the level exceeded the August 2009 peak, the analysts at EWI were quite reasonably looking at Shanghai as developing a wave IV as a triangle, seeing the present rise as a "d" wave. However, as this rise has since March exceeded the limits of the proposed triangle boundary lines, an alternate view needs to be taken.
Therefore, for now, I am staying with the idea that the index is within a wave IV, although I now suspect that the whole up-down-up action from the low in 2008 has been a protracted "b" wave having an internal ABC structure -- of which the internal "C" segment might have just completed at the 61.8% level of wave "a" mentioned above. It is interesting to also note that the "b" wave's "A" segment was just about 38.2% of the wave "a". Also, at this level, the "C" segment is hitting the area which corresponds to between 1.382 and 1.618 the length of the "A" segment.
If that is the case, I suspect that a triangle may still be developing but over a longer period, perhaps with each successive wave to unfold at a Fibonacci retracement (perhaps .618) of previous waves.

MONEY GOES WHEREVER, WITH THE BEST RETURNS A perfect storm waiting to happen with the stock market of major economies like US, Japan, Europe, and most recently China reaching for new highs.
The breakout of China stock market certainly doesn't look healthy at all. Money will find its way where returns are the best, when there's nothing else to invest in the real economy during a slowdown.
Its a game of musical chairs happening every 10 years, be prepared and you'll reap the rewards of the tears. :)

China - if nothing disrupts the dynamics - It could last
"how far can it go?".
Apparently shares trade at 15 PE in aggregate which is still far from outrageous pricing but the granular analysis is different with tech priced outrageously and some other companies trading more reasonably.
From a time perspective, we saw a strong rally lasting 28 months from 2005 to 2007.
Here the rally is only 12 months old.
The best case is: a rally that remains vertical until end of 2016 and reaches 11,500 (40 PE) - That is the bubble scenario to factor in although it is probably not the norm.
The reality will probably be somewhere in between. Maybe all indices globally need to reach the 20 P/E mark later this year.

China - In the mean time - was the strongest indexThere is resistance here but it will probably be broken.
My time target for a top is around October 2015.

Shanghai Class A Index : Short At 4276 : Extreme Greed Broke out from the triangle and has taken a support over previous high on monthly basis ( month not over ) ....The rise has always been an 76 - 79 degree liftoff -- and the fall has also been steep as well ....Will this setup work on closing April basis ...Any red candle on monthly basis in May would signal a correction to lower channel support...

China A ShareSince breakout from triangle / descending wedge (see weekly chart), China A shares has gained ~20%
Long term bull probable, but short term overbought
Over last three month's highs, MACD and RSI both showed marked divergence
Correction likely coming, which could last over a month

Shanghai Class A Index. (Review)Shanghai Class A Index
Indicated Notes also on Chart.
- Price is breaking out from a descending Triangle (B)
- Breaking out from a Large Symmetrical Triangle (A)
- Just Surpassed the 200 sma ( green )
- Above the 50 and 100 sma. supports
- Breaking from a triple top abc.
- RSI overbought. Don't Chase.
- Divergence between Index-Copper.
- Index vs SPX500. Downtrend_line breaking out.
(Over_performance)
- Retest of brake_out necklines-Support.
long term Targets : 2750 - 2844
Support : 2343

China could be ready for a huge breakoutAbsolute growth is still better than in developed markets. Much lower valuations. And look how tightly wound that chart is on the monthly.. and curling open. Keep an eye on your favorite Chinese stocks.

China vs Copper sagaWhat if China has already all the copper it needs, stored or block the outcome of its own mines? What if commodities trading desk of JPM sold to Mercurian is being controlled by China's entities?
What if China is proceeding in the transformation of it's economy to a more consumer based, as it's have been announced for so long.
Crazy and funny rumours or stories of the blogoshere, but the Shangai vs Copper futures shows a multiyear rounding bottom, hinting for an upside break in the future, once it passes the overhead supply.
Last but no least, two excellent reads regarding this issue, one from Frank Holmes and one from Cam Hui
stks.co
stks.co
With regards to $PGJ/$FXI ratio, price went almost parabolic, but there are areas of interest when will correct lower
stks.co
Best or trading guys
Panos


XGYO Bigger Event Ahead in China?2008/09 support already broken and nearing the bottom of the triangle. although the fact that china is pumping new credits into the market. since the 3rd quarter 2011 the SP500 and the Shanghai Index are not entangled anymore. perhaps i will short FXI when the red line is broken with.
sorry the green SP500 looks differently in the published version. do not know how to change it.

Bullish Crab in the Shanghai Class A IndexThe extension would be better if the Index went a little lower and bounced of the 2000 zone. Because a proper crab can get all the way down to 1.618 XA and 2.618 BC. But the index looks like it has found support at some shallower harmonic levels so I am issuing a bullish call to start building a position in Shanghai Class A Shares. A full position will be established if it does another dip to 2000.
If the cloud break occurs I think this index could have a sharp upwards reversal.
