JCI and Indo Export ImportIDX:COMPOSITE tends to follow the movement of Indonesia Import YoY ( ECONOMICS:IDIMP ).
It makes sense since Indonesia's economy is a domestically economy driven, especially by Consumption.
When Import rises, JCI might rises.
COMPOSITE trade ideas

IHSG / COMPOSITE 5 wave rally ? (ELIOT WAVE)First Opinion :
IHSG maybe going to higher price to 8k to complete the 5 wave rally eliot wave (now on phase 4)
the momentum indicator (stochastic) show the sign of bullish divergence. And if the price close higher on 31 oct 2024, there is a big chance IHSG making a bullish continue pattern (Penant).
But we must wait for the validity confirmation on Swing Low on 31 october 2024 (closing price), and the pattern penant must break the trendline (top) for validity.
Second Opinion :
Or IHSG will continue down to key area strong support and rejection at 7350-7400 before rebound to continue the higher price. Still 5 wave rally (eliot wave) in play (because i think IHSG now on phase 4 eliot wave)
DISCLAIMER ON

INDONESIA 2025 ?Hai disini saya mennganalisa berdasarkan data!
FAKTOR-FATOR:
1. Menurut data riset di juni atau juli di tahun 2025 kita masuk kedalam sola rcycle ke 26,
Korelasi IHSG pada puncak cycle tersebut yaitu negatif atau bear.
2. Keresahan terhadap virus atau sejenisnya di Indonesia.
3.?
!! DISCLAIMER BUKAN SUATU AJAKAN INVESTASI !!
update menyusul!

JCI vs IDX30 FamilyThis comparison chart is made to check stocks that move $IDX:COMPOSITE.
I use IDX:IDXV30 , IDX:IDXG30 and IDX:IDXQ30 to see which group of stocks that are leading and laggards.

My longterm view of Jakarta Composite Index (IHSG) is BEARISH.. Based on Elliot Wave perspective, i could see the Composite Index now running on its end of wave 5. It made a huge and wide consolidation around 7k to 7.3k and most likely the consolidation will break and lead to bear season.
I recommend to SELL ON STRENGTH at this time, cause the highest chance for the next trend is bearish trend.
TARGET???
1st: 6500
2nd: 5500
possibly lower than 5000!
Stay alert!!

IHSG The IHSG is currently experiencing a weakening trend in the monthly trend, but in the long term, it is still in a bullish trend. However, I see that the IHSG has formed an ABCD pattern. Theoretically, the IHSG will experience a correction with the following targets:
Support 1: 6350
Support 2: 6000
Support 3: 5700
If the IHSG does not reach 6780, this theory will fail.

My view for Composite (IHSG)Based on wave counting, the extended "B" has been formed and now the big "C" correction is on its way.
I believe in some coming weeks we will have a huge correction..
#BEARISH

IHSG has potential to retest previous highIHSG has potential to complete inverse cup and handle with target near previous high.
With less than a month left for 2023, IHSG will probably on track to reach its previous high before year end, finger crossed.

IDX Composite - Jan 2024From Nov 23 - Composite has gone up for around 10% until the current date.
Some news says " there is a pull back as rate cut rally dissipates"
for IDX, we must see using the Indonesia's rate policy, which now is in a good stand, inflation is under control, most of big companies performance for the last 9months have shown a significant growth. Our Banking industries', which accounted to around 50% of the Composite portion's, growth also in the good direction.
We are still waiting for the last quarter performance result
I believe, this year, though it's a political year for indonesia, IDX COMPOSITE will still grow higher than last year

New Direction of JCI and Indo Bond 10YrComparison between composite and Indo bond 10yr.
JCI is predicted to rise while Indo Bond is predicted to fall.

COMPOSITE JCI - POTENTIAL DROPCOMPOSITE - has a potential drop to 6892, reason is because there's a resistance zone above, and a potential time resistance.
COMPOSITE will stop dropping until the 29th November (Wed). And could potentially rebound after.

COMPOSITE - POTENTIAL PRIMARY MOVEMENT TO 6962COMPOSITE - POTENTIAL PRIMARY MOVEMENT TO 6962. The JCI recently has broke it's inverted head and shoulders pattern. The target price is likely at 6962 (Fib Cluster Zone), and it will be a one swing movement until 16 Nov 2023.

JCI, IHSG - Potential Time Peak & BottomJCI will most likely hit it's peak at
a target price 6887.82 today (7th Nov 2023).
And could potentially make a bottom
(reversal) on (13th Nov 2023)

IHSG Ready for Bearish MovementIHSG ready for bearish movement when support trendline is breakout
if breakout ready to retest 6.5k level and 5.7k level

JCI COMPOSITE - BOTTOM DATE & PRICEJCI (Index Harga Saham Gabungan) has crashed and gone down -1,7% in one day.
Here's my analysis of the turning point dates and the price bottom dates.
IMPORTANT DATE:
- 26 October 2023
- 2nd November 2023

IHSG will retest to the next resistantIDX:COMPOSITE
I guess the next couple of weeks will be boring sideways again.

Composite is bullishConfirming with AD line, making new high and new low, as long as it doesnt break the trend, composite is on the right track to break 7000 level :)

IDX Composite_31 August 2023the IDX failed to close at 7000 yesterday and today its back to 6939 level, but if we look at the bigger picture, IDX is still on uptrend, as long as it can maintain the minimum level at 6882 we are still in a good path
If we see A/D line, this indicator also still convergence with the IDX
Hopefully in a few weeks /month before year end, we can see the IDX back to level 7000 even more
Since our index mostly is supported by finance industry (more than 50% weight), with the help of the Big banks performances (Good sign), our beloved IDX will come back stronger
Patience is the key to success.
#plan_trade_repeat
#plan_trade_repeat

#IDX can be bullish trend next week ??Next week will be decisive by #IDX and supported by 2 potential bullish trends, where the candlestick pattern (cup and handle and bullish flag) that is formed clearly indicates a strengthening towards 7300.
but these 2 chart patterns will fail if next week they are under pressure and stay below 6850.

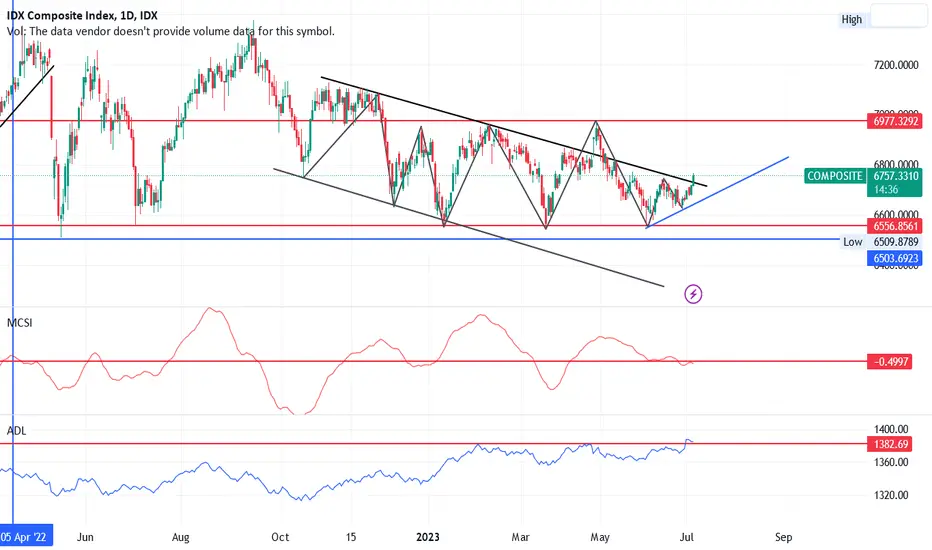
COMPOSITEIf We see period from 5 june to today 6 july, there is a symmetrical triangle pattern formed and
today's closing above the upper trend line of the symmetrical triangle. if the price is staying on this level, it's possible to reach next resistance on 6822.
If we assess using AD Line indicator, we can see that the ADline is recording a new high which means more stocks are following this trend
But if we see using McClellan Summation index, it shows the money havent entered the market yet which make the market will retrace for some time
so is composite will go higher or retrace for some time? only time will tell
@plan_trade_repeat
IDX Composite Index (IHSG) Swing Trend AnalysisJune 21th 2023 IDX Composite Index (IHSG) Swing Trend Analysis
This Analysis is Based on ICT/SMC Market Structure in Daily TF
The information I provide should not be considered as financial or investment advice. Forex trading involves significant risk, and it is important to conduct thorough research and seek advice from qualified professionals before making any trading decisions.


JCI and Yield Indonesia 10Yr are looking goodComposite is about to start its long term Uptrend while id10y is continuing Downtrend
