Technical Weekly AnalysisStart your week by identifying the key price levels and trends.
The SpreadEx Research team has analysed the most popular markets, including stocks, indices, commodities & forex.
--------------------------------------------------------------------------------------------------------------
Analysis
Germany 40 is currently in a neutral trend, moving within a range phase. It's trading at 23,851, holding above its VWAP of 23,582, suggesting limited directional conviction. The RSI at 53 indicates a balanced market. Support is at 22,985, while resistance is at 24,179.
UK 100 remains in a neutral trend and range phase, hovering around its VWAP at 8,800, with price at 8,805. This shows a lack of strong momentum. The RSI at 53 confirms indecision. Support lies at 8,734, while resistance is at 8,881.
Wall Street continues its bullish trend and is in an extended impulsive phase, trading at 44,681, significantly above its VWAP of 43,119. This highlights ongoing upside strength. The RSI at 72 suggests the market has entered overbought conditions. Support is seen at 41,002, with resistance at 45,236.
Brent Crude is in a neutral trend and range phase, trading at 6,802, still below the VWAP of 7,045 following the steep correction. This implies modest weakness. The RSI at 48 supports the lack of strong momentum. Support is at 6,217, while resistance is at 7,873.
Gold remains in a neutral range-bound trend underneath record highs, currently priced at 3,310, just under its VWAP of 3,347. The RSI at 46 signals a lack of directional conviction. Support is at 3,262, with resistance at 3,432.
EUR/USD is bullish and in an impulsive phase, with price at 1.1748, well above its VWAP of 1.1646 and at a multi-year high. The RSI at 65 after reaching overbought conditions is a warning sign. Support is at 1.1402, with resistance extending to 1.8897.
GBP/USD holds a bullish trend and is in a pullback phase after hitting a multi-year high, trading at 1.3606, right in line with its VWAP. RSI at 51 indicates neutral momentum with signs of bearish divergence from price. Support is seen at 1.3373, with resistance at 1.3818.
USD/JPY is in a neutral trend and range phase, trading at 145.06, matching its VWAP level. This equilibrium reflects indecision. The RSI at 53 aligns with a directionless market. Support sits at 143.28, with resistance at 146.34.
DEU40 trade ideas

German30The Asian session traded fairly low today looking to target yesterdays low however we are forming a bullish flag pattern indicating that we will continue the uptrend.
We will take advantage of this opportunity and look to target 200 pips on this setup. Remember to always trade cautiously and like and subscriber for more A+ setups

DAX40 Bullish consolidation breakout Trend Overview:
The DAX index maintains a bullish overall sentiment, supported by a sustained rising trend on the higher timeframes. However, recent intraday price action suggests a corrective pullback and consolidation phase, likely part of a broader continuation pattern.
Key Support and Resistance Levels:
Support:
Initial support: 23,330 – a key previous consolidation area and pivot level
Below that: 23,170, then 22,970 as deeper retracement levels
Resistance:
Near-term upside target: 24,030
Further resistance: 24,130 and 24,345 over the longer term
Scenarios:
Bullish Continuation:
A bounce from 23,330 would confirm this level as valid support
Sustained strength could drive price toward 24,030, then 24,130 and 24,345
Bearish Breakdown:
A daily close below 23,330 would invalidate the bullish setup
Opens potential for deeper pullbacks toward 23,170 and 22,970
Conclusion:
The DAX remains bullish in structure but is currently consolidating. Watch the 23,330 support zone closely—its ability to hold will determine whether bulls regain control or if a deeper correction unfolds. A bounce here would favor upside targets; a confirmed breakdown shifts the outlook to short-term bearish.
This communication is for informational purposes only and should not be viewed as any form of recommendation as to a particular course of action or as investment advice. It is not intended as an offer or solicitation for the purchase or sale of any financial instrument or as an official confirmation of any transaction. Opinions, estimates and assumptions expressed herein are made as of the date of this communication and are subject to change without notice. This communication has been prepared based upon information, including market prices, data and other information, believed to be reliable; however, Trade Nation does not warrant its completeness or accuracy. All market prices and market data contained in or attached to this communication are indicative and subject to change without notice.

DAX H4 | Heading into a swing-high resistanceThe DAX (GER30) is rising towards a swing-high resistance and could potentially reverse off this level to drop lower.
Sell entry is at 24,104.89 which is a swing-high resistance that aligns closely with the 78.6% Fibonacci retracement.
Stop loss is at 24,380.00 which is a level that sits above the 127.2% Fibonacci extension and a swing-high resistance.
Take profit is at 23,714.12 which is an overlap support.
High Risk Investment Warning
Trading Forex/CFDs on margin carries a high level of risk and may not be suitable for all investors. Leverage can work against you.
Stratos Markets Limited (tradu.com ):
CFDs are complex instruments and come with a high risk of losing money rapidly due to leverage. 63% of retail investor accounts lose money when trading CFDs with this provider. You should consider whether you understand how CFDs work and whether you can afford to take the high risk of losing your money.
Stratos Europe Ltd (tradu.com ):
CFDs are complex instruments and come with a high risk of losing money rapidly due to leverage. 63% of retail investor accounts lose money when trading CFDs with this provider. You should consider whether you understand how CFDs work and whether you can afford to take the high risk of losing your money.
Stratos Global LLC (tradu.com ):
Losses can exceed deposits.
Please be advised that the information presented on TradingView is provided to Tradu (‘Company’, ‘we’) by a third-party provider (‘TFA Global Pte Ltd’). Please be reminded that you are solely responsible for the trading decisions on your account. There is a very high degree of risk involved in trading. Any information and/or content is intended entirely for research, educational and informational purposes only and does not constitute investment or consultation advice or investment strategy. The information is not tailored to the investment needs of any specific person and therefore does not involve a consideration of any of the investment objectives, financial situation or needs of any viewer that may receive it. Kindly also note that past performance is not a reliable indicator of future results. Actual results may differ materially from those anticipated in forward-looking or past performance statements. We assume no liability as to the accuracy or completeness of any of the information and/or content provided herein and the Company cannot be held responsible for any omission, mistake nor for any loss or damage including without limitation to any loss of profit which may arise from reliance on any information supplied by TFA Global Pte Ltd.
The speaker(s) is neither an employee, agent nor representative of Tradu and is therefore acting independently. The opinions given are their own, constitute general market commentary, and do not constitute the opinion or advice of Tradu or any form of personal or investment advice. Tradu neither endorses nor guarantees offerings of third-party speakers, nor is Tradu responsible for the content, veracity or opinions of third-party speakers, presenters or participants.

Long ScalpLong Scalp on DAXEUR.
Reasons to take the trade:
1. Major Bull Trendline test
2. Micro Double Bottom Pullback
3. Bullish Doji with long lower tail
4. Breakout Pullback to the EMA with double overshoot
5. It's an almost perfect 50% retracement of the last bull leg (that has a small one candle bear leg in the middle).
Reasons to Passe on it:
1. The last bear candle is bigger than I wanted, so this might be the first bear leg of the new trend.

DAX: Strong Growth Ahead! Long!
My dear friends,
Today we will analyse DAX together☺️
The market is at an inflection zone and price has now reached an area around 23,758.99 where previous reversals or breakouts have occurred.And a price reaction that we are seeing on multiple timeframes here could signal the next move up so we can enter on confirmation, and target the next key level of 23,821.90.Stop-loss is recommended beyond the inflection zone.
❤️Sending you lots of Love and Hugs❤️

DE40 – Buy the Dip as Bottom Formation EmergesTrade Idea
Type: Buy Limit
Entry: 23,600
Target: 23,900
Stop Loss: 23,450
Duration: Intraday
Expires: 03/07/2025 06:00
Technical Overview
Recent price action suggests a bottom is forming, setting the stage for a potential upward move.
Further upside is expected, but current levels offer a poor risk/reward for immediate buying — instead, waiting for a dip to 23,600 is preferred.
A confirmed move above 23,750 would signal renewed bullish momentum, aligning with a measured move target around 24,000.
Traders should be mindful of ECB President Lagarde’s speech at 15:15 UTC, which may influence overall risk sentiment and European indices.
Key Technical Levels
Support: 23,700 / 23,600 / 23,500
Resistance: 23,800 / 23,900 / 24,000
Disclosure: I am part of Trade Nation's Influencer program and receive a monthly fee for using their TradingView charts in my analysis.

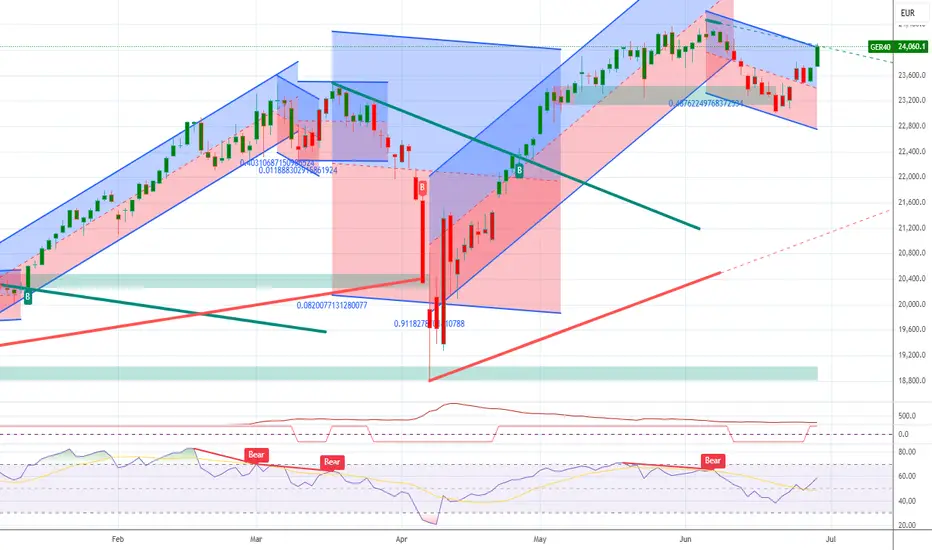
Potential long trade DAXRisk appetite seems to have returned to the market with most global indices reaching new all time highs. The DAX should be no exception to joining the long rally with tariff jitters become the least of investor worries. The overall trend on a daily chart and 4H are bullish. A clear break of the short-term retracement trendline should spark another bullish sequence the could create new highs.
Buy signal TiqGPT MARKET NARRATIVE:
Analyzing the Germany 40 across multiple timeframes, we observe a complex interplay of institutional activity and liquidity dynamics. Starting from the daily chart down to the 1-minute chart, there is a visible shift in market structure and momentum that suggests a nuanced institutional footprint.
Daily Chart (1D): The market shows a series of bullish and bearish candles with no clear directional bias, indicating a phase of distribution where institutions might be balancing their positions. The presence of wicks on both sides of the candles suggests indecision and liquidity hunts at both higher and lower price levels.
4-Hour Chart (4H): Recent candles show a sharp decline followed by a recovery, indicating a potential sweep of lows to capture liquidity below prior lows. This could be an inducement phase to trap bearish retail traders before a possible upward move.
1-Hour Chart (1H): The sharp downward candle followed by smaller bullish candles suggests a reaction from a liquidity pool or a mitigation block, indicating that institutions might be absorbing sell-side liquidity and potentially preparing for a push higher.
15-Minute Chart (15M): This timeframe shows a clearer picture of the liquidity sweep with a sharp decline and subsequent recovery, suggesting a possible change of character (CHoCH) from bearish to bullish.
5-Minute Chart (5M) and 1-Minute Chart (1M): Both these lower timeframes show consolidation after a sharp move down, typically indicative of accumulation after a liquidity sweep, setting the stage for a potential bullish reversal.
INSTITUTIONAL THESIS:
The overarching thesis is that institutions are likely in the phase of accumulation after having engineered a liquidity sweep across multiple lower timeframes. The expectation is for a bullish reversal as retail bearish positions are likely trapped.
LEARNING POINT:
"1H liquidity sweep and mitigation followed by potential accumulation on lower timeframes."
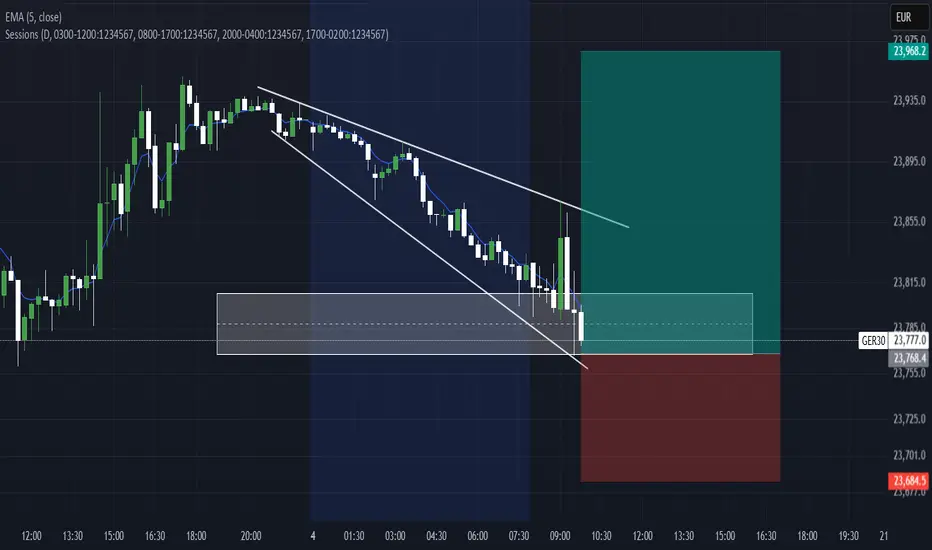
SIGNAL: BUY
SYMBOL: Germany 40
ENTRY PRICE: $23,720
STOP LOSS: $23,700
TARGET PRICE: $23,780
CONDITION: Buy limit order post-confirmation of bullish momentum on 15M chart.
RATIONALE: The setup aligns with a liquidity sweep followed by accumulation, a typical institutional play. The entry is set just above the recent consolidation, targeting the next potential liquidity pool.
STRATEGIES USED: Liquidity Sweep and Accumulation Phase
URGENCY: MEDIUM
TIMEFRAME: Short-term
CONFIDENCE SCORE: 85%
RISK/REWARD RATIO: Risk=$20.00, Reward=$60.00, Ratio=1:3.0

DAX bullish breakout resistance at 24030Trend Overview:
The DAX index maintains a bullish overall sentiment, supported by a sustained rising trend on the higher timeframes. However, recent intraday price action suggests a corrective pullback and consolidation phase, likely part of a broader continuation pattern.
Key Support and Resistance Levels:
Support:
Initial support: 23,330 – a key previous consolidation area and pivot level
Below that: 23,170, then 22,970 as deeper retracement levels
Resistance:
Near-term upside target: 24,030
Further resistance: 24,130 and 24,345 over the longer term
Scenarios:
Bullish Continuation:
A bounce from 23,330 would confirm this level as valid support
Sustained strength could drive price toward 24,030, then 24,130 and 24,345
Bearish Breakdown:
A daily close below 23,330 would invalidate the bullish setup
Opens potential for deeper pullbacks toward 23,170 and 22,970
Conclusion:
The DAX remains bullish in structure but is currently consolidating. Watch the 23,330 support zone closely—its ability to hold will determine whether bulls regain control or if a deeper correction unfolds. A bounce here would favor upside targets; a confirmed breakdown shifts the outlook to short-term bearish.
This communication is for informational purposes only and should not be viewed as any form of recommendation as to a particular course of action or as investment advice. It is not intended as an offer or solicitation for the purchase or sale of any financial instrument or as an official confirmation of any transaction. Opinions, estimates and assumptions expressed herein are made as of the date of this communication and are subject to change without notice. This communication has been prepared based upon information, including market prices, data and other information, believed to be reliable; however, Trade Nation does not warrant its completeness or accuracy. All market prices and market data contained in or attached to this communication are indicative and subject to change without notice.

DAX Long Position ManagementI'm long on DAX since last week, but market made a sharp and strong correction today. Bears showed a lot of strength today, so tomorrow is going to be key.
If the market bounces of the bull trendline me might see another leg up to the previous high. But given the strength of this pullback, the probability of getting to the All Time High in the next few days is much lower than I thought. This way, I'm watching closely to see if the market is going to bounce. Even if it does, if the momentum is not extremely strong, I'll be trailing my SL and exit with a smaller profit.

Technical Weekly AnalysisStart your week by identifying the key price levels and trends.
The SpreadEx Research team has analysed the most popular markets, including stocks, indices, commodities & forex.
--------------------------------------------------------------------------------------------------------------
Analysis
Germany 40 is neutral and ranging, eyeing a possible breakout. It trades at 24,021, close to its VWAP of 23,601. The RSI at 58 shows mild bullish bias. Support is at 22,882 and resistance at 24,320.
UK 100 is also in a neutral range phase, trading at 8,791 just under the VWAP of 8,833 - still with 9k on the horizon. RSI sits at 52, indicating balance. Key support lies at 8,731, with resistance at 8,916.
Wall Street has broken out above 43k into a new bullish phase. It’s trading at 44,032, significantly above its VWAP of 42,673. RSI at 71 confirms strong upward momentum. Support is at 41,379, resistance is being tested now.
Brent Crude is currently in a neutral range phase, trading at 6,699 having slumped back below its VWAP of 7,063. The RSI at 45 signals low momentum. Support is noted at 6,206, with resistance at 7,919.
Gold is moving sideways in a neutral range, drifting lower after a failed breakout over 3,400, priced at 3,293 with VWAP at 3,349. RSI is soft at 44. Support comes in at 3,252 and resistance at 3,446.
EUR/USD is bullish and breaking out - with the 1.20 handle in sight. It trades at 1.1722, easily above the VWAP of 1.1552. RSI at 71 reflects strong buying pressure. Support is at 1.1349, resistance at 1.1730.
GBP/USD is bullish and moving impulsively. It trades at 1.3700, above the VWAP of 1.3559. RSI at 63 signals steady upward momentum. Support sits at 1.3358, and resistance at 1.3761.
USD/JPY is neutral and ranging, trading at 144.13 slightly below VWAP at 144.87. The RSI is weak at 46. Support via May & June lows is only just below with the 2 s.d. of the VWAP at 143.42, while resistance is higher at 146.32.

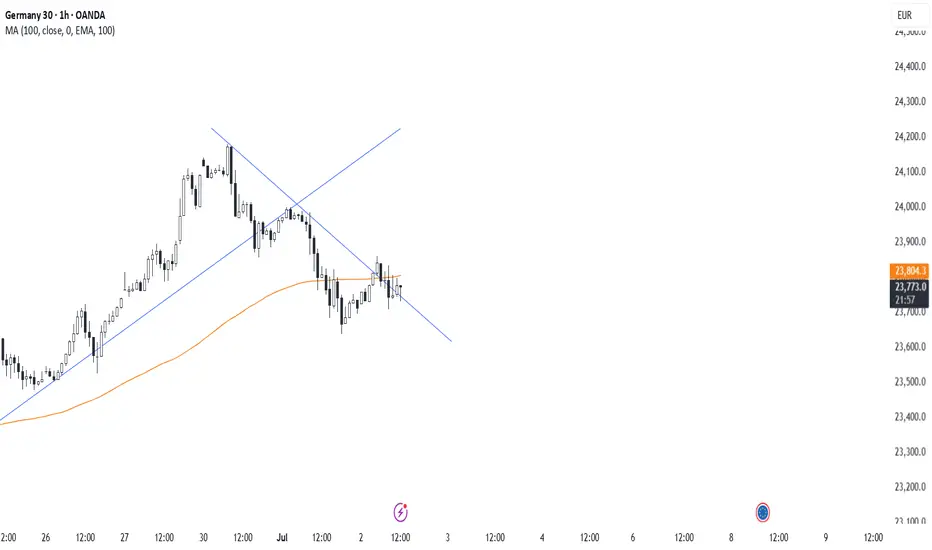
DAX H4 | Bullish uptrend to extend further?The DAX (GER30) could fall towards a pullback support and potentially bounce off this level to climb higher.
Buy entry is at 24,077.90 which is a pullback support.
Stop loss is at 23,850.00 which is a level that lies underneath a pullback support and a Fibonacci confluence zone identified by the 23.6% and 38.2% retracements.
Take profit is at 24,369.51 which is a multi-swing-high resistance.
High Risk Investment Warning
Trading Forex/CFDs on margin carries a high level of risk and may not be suitable for all investors. Leverage can work against you.
Stratos Markets Limited (tradu.com ):
CFDs are complex instruments and come with a high risk of losing money rapidly due to leverage. 63% of retail investor accounts lose money when trading CFDs with this provider. You should consider whether you understand how CFDs work and whether you can afford to take the high risk of losing your money.
Stratos Europe Ltd (tradu.com ):
CFDs are complex instruments and come with a high risk of losing money rapidly due to leverage. 63% of retail investor accounts lose money when trading CFDs with this provider. You should consider whether you understand how CFDs work and whether you can afford to take the high risk of losing your money.
Stratos Global LLC (tradu.com ):
Losses can exceed deposits.
Please be advised that the information presented on TradingView is provided to Tradu (‘Company’, ‘we’) by a third-party provider (‘TFA Global Pte Ltd’). Please be reminded that you are solely responsible for the trading decisions on your account. There is a very high degree of risk involved in trading. Any information and/or content is intended entirely for research, educational and informational purposes only and does not constitute investment or consultation advice or investment strategy. The information is not tailored to the investment needs of any specific person and therefore does not involve a consideration of any of the investment objectives, financial situation or needs of any viewer that may receive it. Kindly also note that past performance is not a reliable indicator of future results. Actual results may differ materially from those anticipated in forward-looking or past performance statements. We assume no liability as to the accuracy or completeness of any of the information and/or content provided herein and the Company cannot be held responsible for any omission, mistake nor for any loss or damage including without limitation to any loss of profit which may arise from reliance on any information supplied by TFA Global Pte Ltd.
The speaker(s) is neither an employee, agent nor representative of Tradu and is therefore acting independently. The opinions given are their own, constitute general market commentary, and do not constitute the opinion or advice of Tradu or any form of personal or investment advice. Tradu neither endorses nor guarantees offerings of third-party speakers, nor is Tradu responsible for the content, veracity or opinions of third-party speakers, presenters or participants.

GER40 LongDAX is now net long on the regression break.
Global market are rising, however there is strong hedging in the Bond markets.
I am not taking this trade.

Trade setup via TiqGPTAnalyzing the Germany 40 across multiple timeframes, we observe a consistent bullish momentum, particularly evident in the daily and 4-hour charts. The daily charts (Chart 1 and Chart 2) show a series of green candles indicating strong buying pressure. The 4-hour chart (Chart 3) confirms this with a clear upward trend and higher highs. The 1-hour (Chart 4) and 15-minute (Chart 5) charts show some intraday pullbacks, which are typical in a healthy uptrend, providing potential entry points for continuation trades.
INSTITUTIONAL THESIS:
Institutions appear to be in an accumulation phase, pushing the price upward to potentially target higher liquidity zones above the current price levels. The consistent higher highs and higher lows across the timeframes suggest a strong bullish bias with institutional backing.
LEARNING POINT:
The presence of unmitigated Order Blocks (OB) on the 1-hour and 15-minute charts after a liquidity sweep indicates potential areas for price to revisit before continuing the uptrend.
SIGNAL: BUY
SYMBOL: Germany 40
ENTRY PRICE: $23,800.3
STOP LOSS: $23,780.0
TARGET PRICE: $23,880.0
CONDITION: Buy limit after sweep of daily low confirms BOS on 15M
RATIONALE:
Break of Structure (BOS): Confirmed on the 15M chart with a strong bullish candle closing above previous highs.
Order Block (OB): Entry at the mitigation of the 15M OB at $23,800.3.
Liquidity Targeting: Targeting the next high at $23,880.0, which is a recent peak and likely a liquidity pool.
Market Maker Model Phase: Accumulation phase evident, expecting continuation of the uptrend.


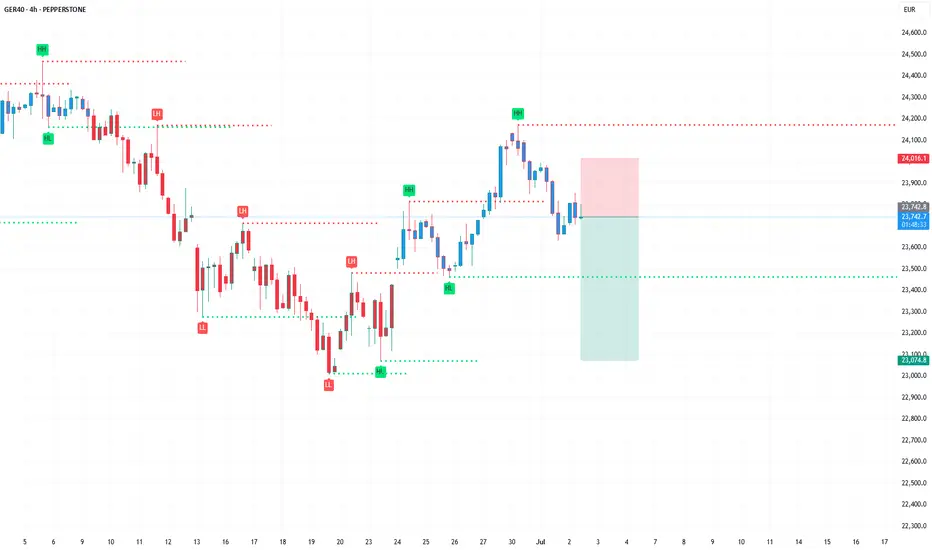
DAX Inverse Head and Shoulders target 24600!DAX (DE40) is about to complete an Inverse Head and Shoulders (IH&S) pattern, with the price currently stuck in range within the 4H MA50 (blue trend-line) and the 4H MA200 (orange trend-line).
A 4H candle closing above the 4H MA200, confirms the IH&S pattern and the bullish break-out technically targets the 2.0 Fibonacci extension, currently a little above 24600. On top of that, the break-out may be accompanied by a 1D MAD Bullish Cross, further confirmation of the bullish sentiment.
-------------------------------------------------------------------------------
** Please LIKE 👍, FOLLOW ✅, SHARE 🙌 and COMMENT ✍ if you enjoy this idea! Also share your ideas and charts in the comments section below! This is best way to keep it relevant, support us, keep the content here free and allow the idea to reach as many people as possible. **
-------------------------------------------------------------------------------
Disclosure: I am part of Trade Nation's Influencer program and receive a monthly fee for using their TradingView charts in my analysis.
💸💸💸💸💸💸
👇 👇 👇 👇 👇 👇

Lagarde Boosts the Euro and the DAXLagarde Boosts the Euro and the DAX: Is the ECB Putting an End to the Rate-Cut Cycle?
Ion Jauregui - ActivTrades Analyst
European Central Bank President Christine Lagarde delivered a key speech before the European Parliament that has shaken financial markets, pushing the euro to multi-year highs and boosting stock market optimism in Germany. Her message, full of signals of monetary stability and strategic progress such as the digital euro, was interpreted as the official end to the rate-cut cycle that began in 2024.
“Risks to growth remain tilted to the downside, but current conditions do not justify further adjustments,” Lagarde told EU lawmakers.
The Euro Nears New Highs After ECB Message
Currency markets reacted immediately. EUR/USD climbed to the 1.1700 zone, reaching levels not seen since December 2021. The move was reinforced by the ECB’s firm tone and a weaker dollar, also impacted by U.S. tensions following controversial statements from President Trump regarding the Federal Reserve.
From a technical standpoint, the euro maintains a clearly bullish bias. It trades above all relevant moving averages and with an RSI close to 71%, indicating strength but also overbought risk that could pull the price back to the control area around 1.13764, the current consolidation zone. The next key level is at 1.1800, while support levels are at 1.10792 and 1.09823.
The DAX Heads Toward New Highs
The German stock market also welcomed the ECB’s message of stability. The DAX, already showing strength in previous sessions, is trading around 23,673 points at today’s open, very close to its current high of 24,455.98 points. The index is benefiting from a stable rate environment, improved economic sentiment in Germany — reflected in the Ifo index rebound — and a recovery in the industrial sector.
Technically, a sustained close above 23,000 points would open the door for a move toward 25,000, while any correction would find support near 21,500. The RSI, currently around 52%, suggests there is still room for further price expansion, given that the 19,960 support was clearly confirmed in the latest technical rebound.
What’s Next for the Markets?
With European monetary policy entering a pause phase, investors are now focusing on two areas: the evolution of economic growth in the eurozone, and the direction of the dollar, shaped by political tensions in Washington and Jerome Powell’s testimony later this week.
Lagarde also brought up the push for the digital euro, a strategic initiative aimed at reinforcing the bloc’s financial autonomy amid global rivals like China and the United States.
Conclusion:
The ECB pauses, but markets move forward. Both the euro and the DAX are showing signs of strength after Lagarde’s speech. If macro conditions remain supportive, we may be entering a new stage of consolidation for European assets.
*******************************************************************************************
The information provided does not constitute investment research. The material has not been prepared in accordance with the legal requirements designed to promote the independence of investment research and such should be considered a marketing communication.
All information has been prepared by ActivTrades ("AT"). The information does not contain a record of AT's prices, or an offer of or solicitation for a transaction in any financial instrument. No representation or warranty is given as to the accuracy or completeness of this information.
Any material provided does not have regard to the specific investment objective and financial situation of any person who may receive it. Past performance is not reliable indicator of future performance. AT provides an execution-only service. Consequently, any person acting on the information provided does so at their own risk.

DAX H4 | Potential bearish reversalThe DAX (GER30) is rising towards a swing-high resistance and could potentially reverse off this level to drop lower.
Sell entry is at 23,740.18 which is a swing-high resistance.
Stop loss is at 23,960.00 which is a level that sits above the 61.8% Fibonacci retracement and an overlap resistance.
Take profit is at 23,341.19 which is a pullback support that aligns with the 61.8% Fibonacci retracement.
High Risk Investment Warning
Trading Forex/CFDs on margin carries a high level of risk and may not be suitable for all investors. Leverage can work against you.
Stratos Markets Limited (tradu.com ):
CFDs are complex instruments and come with a high risk of losing money rapidly due to leverage. 63% of retail investor accounts lose money when trading CFDs with this provider. You should consider whether you understand how CFDs work and whether you can afford to take the high risk of losing your money.
Stratos Europe Ltd (tradu.com ):
CFDs are complex instruments and come with a high risk of losing money rapidly due to leverage. 63% of retail investor accounts lose money when trading CFDs with this provider. You should consider whether you understand how CFDs work and whether you can afford to take the high risk of losing your money.
Stratos Global LLC (tradu.com ):
Losses can exceed deposits.
Please be advised that the information presented on TradingView is provided to Tradu (‘Company’, ‘we’) by a third-party provider (‘TFA Global Pte Ltd’). Please be reminded that you are solely responsible for the trading decisions on your account. There is a very high degree of risk involved in trading. Any information and/or content is intended entirely for research, educational and informational purposes only and does not constitute investment or consultation advice or investment strategy. The information is not tailored to the investment needs of any specific person and therefore does not involve a consideration of any of the investment objectives, financial situation or needs of any viewer that may receive it. Kindly also note that past performance is not a reliable indicator of future results. Actual results may differ materially from those anticipated in forward-looking or past performance statements. We assume no liability as to the accuracy or completeness of any of the information and/or content provided herein and the Company cannot be held responsible for any omission, mistake nor for any loss or damage including without limitation to any loss of profit which may arise from reliance on any information supplied by TFA Global Pte Ltd.
The speaker(s) is neither an employee, agent nor representative of Tradu and is therefore acting independently. The opinions given are their own, constitute general market commentary, and do not constitute the opinion or advice of Tradu or any form of personal or investment advice. Tradu neither endorses nor guarantees offerings of third-party speakers, nor is Tradu responsible for the content, veracity or opinions of third-party speakers, presenters or participants.

DAX Bullish breakout supported at 23330Trend Overview:
The DAX index maintains a bullish overall sentiment, supported by a sustained rising trend on the higher timeframes. However, recent intraday price action suggests a corrective pullback and consolidation phase, likely part of a broader continuation pattern.
Key Support and Resistance Levels:
Support:
Initial support: 23,330 – a key previous consolidation area and pivot level
Below that: 23,170, then 22,970 as deeper retracement levels
Resistance:
Near-term upside target: 24,030
Further resistance: 24,130 and 24,345 over the longer term
Scenarios:
Bullish Continuation:
A bounce from 23,330 would confirm this level as valid support
Sustained strength could drive price toward 24,030, then 24,130 and 24,345
Bearish Breakdown:
A daily close below 23,330 would invalidate the bullish setup
Opens potential for deeper pullbacks toward 23,170 and 22,970
Conclusion:
The DAX remains bullish in structure but is currently consolidating. Watch the 23,330 support zone closely—its ability to hold will determine whether bulls regain control or if a deeper correction unfolds. A bounce here would favor upside targets; a confirmed breakdown shifts the outlook to short-term bearish.
This communication is for informational purposes only and should not be viewed as any form of recommendation as to a particular course of action or as investment advice. It is not intended as an offer or solicitation for the purchase or sale of any financial instrument or as an official confirmation of any transaction. Opinions, estimates and assumptions expressed herein are made as of the date of this communication and are subject to change without notice. This communication has been prepared based upon information, including market prices, data and other information, believed to be reliable; however, Trade Nation does not warrant its completeness or accuracy. All market prices and market data contained in or attached to this communication are indicative and subject to change without notice.
