There is a possible down push on xauusdIf the trend can break through the resistance there's possibly a little long down push on xauusd
DXY trade ideas

Bullish on EURUSD till Q1 2026Looking at the chart, I remained bullish on the Euro dollars for the mid term.
Those who followed , would have made some good profits.
Any pullback on EURUSD remains a good entry to accumulate.
As usual, please DYODD

Forex Weekly Round-Up - 30th Jun 25Dollar Index:
Dollar Index declined further, hovering near 97.0–96.9 — its weakest level since February 2022.
Key Driver: Markets digested a slightly hotter US core PCE inflation report (+2.3% YoY for May), paired with weak personal spending, reinforcing expectations that the Federal Reserve might pivot to rate cuts later this year.
GBPUSD:
The pound surged, touching highs around 1.3770 — its strongest in nearly four years — before dipping slightly to finish the week near 1.3720
Weekly gain clocked in around +2%, the largest move since early March
Rally Fuelled By : Broader dollar weakness, easing Middle East tensions (ceasefire), and dovish Fed signals suggesting potential rate cuts.
EURUSD
The euro enjoyed a rally, peaking near 1.1754 — its highest since September 2021 — before closing the week around 1.1720
Weekly gain came to approximately +1.7% to +1.9%, driven by euro strength and broad weakness in the US dollar
Traders are eyeing upcoming US data (PCE inflation, Michigan sentiment) for next directional cues
------------------------------------
I will be approaching the markets differently from now on.
Based on the feedback from past analysis, I will be compiling all related pairs into one video, giving you guys the ability to see how one asset affects the other.
This is called inter-market relationship and it's something i've been doing for years.
It gives you confidence on what pairs are 'Hot Picks' and the ones that have a high chance of not delivering the way you want.

Risk On! The US Dollar Is Weak! Buy The Major Pairs!This is the FOREX futures outlook for the week of Jun 29 - July 4th.
In this video, we will analyze the following FX markets:
USD Index, EUR, GBP, AUD, NZD, CAD, CHF, and JPY.
Investors are taken money out of safe havens and putting it into risk assets. The US Dollar saw those outflows last week, and we are likely to see that continue going into this week.
Buy the EUR, GBP and CHF vs USD. JPY should also see some upside.
The AUD and NZD continue to grind upwards as well.
Enjoy!
May profits be upon you.
Leave any questions or comments in the comment section.
I appreciate any feedback from my viewers!
Like and/or subscribe if you want more accurate analysis.
Thank you so much!
Disclaimer:
I do not provide personal investment advice and I am not a qualified licensed investment advisor.
All information found here, including any ideas, opinions, views, predictions, forecasts, commentaries, suggestions, expressed or implied herein, are for informational, entertainment or educational purposes only and should not be construed as personal investment advice. While the information provided is believed to be accurate, it may include errors or inaccuracies.
I will not and cannot be held liable for any actions you take as a result of anything you read here.
Conduct your own due diligence, or consult a licensed financial advisor or broker before making any and all investment decisions. Any investments, trades, speculations, or decisions made on the basis of any information found on this channel, expressed or implied herein, are committed at your own risk, financial or otherwise.

DXY 4hour TF - June 29th, 2025DXY 6/29/25
DXY Bearish Idea
All significant timeframes (monthly,weekly,daily 4hr) appear bearish for now.
Last week on June 25th, 2025 we saw price action break through our 98.000 zone confirming more bearish movement. This week we have two likely options that we will wait for confirmation on.
Bearish Continuation - Ideally we keep with the trend and look for lower highs below 98.000 for further confirmation. If we can spot rejection from this zone it is likely we will see DXY continue bearish for the week ahead.
Reversal - This is less likely but still possible. Price action could punch back through the 98.000 resistance and begin retesting previous highs. If this happens look for candlestick confirmation above 98.000 and expect a more bullish DXY for the week ahead.

Skeptic | Weekly Watchlist : DXY Triggers & Pro SetupsLast week, DXY played out our bearish scenario perfectly, breaking the short trigger at 98.530 and delivering a strong downward move . With Higher Wave Cycle (HWC) and Minor Wave Cycle (MWC) now bearish, I’m leaning heavier on short positions with tighter risk management. Let’s break it down with no FOMO, no hype, just reason. 📊
Daily Timeframe: The Big Picture
The key support at 98.801 was decisively broken, and we’ve confirmed below it—the major trend is now fully bearish. The next daily support lies at 96.478 , but I expect range-bound action early this week, especially after last week’s big move. Patience is key—let the market form a clear structure before jumping back in.
Key Insight: The bearish trend is locked in, but early-week consolidation is likely. Wait for the market to signal its next move.
4-Hour Timeframe: Long & Short Triggers
Zooming into the 4-hour chart, let’s pinpoint Low Wave Cycle (LWC) and triggers for long and short setups:
Short Trigger: Break below 4-hour support at 96.995 , confirmed by RSI re-entering oversold. Want to wield RSI like a pro? Check out my RSI Masterclass —it’s a game-changer! 😏
Long Trigger: Break above resistance at 98.215 . This is riskier since it’s against the bearish trend—set a wider stop-loss and take profits quickly. Why? HWC and MWC are bearish, so the first uptrend wave risks stop-loss hunts or fakeouts. I’ll drop an HWC/MWC/LWC guide soon to optimize entries, stops, and more—stay tuned!
Pro Tip: For longs, expect volatility in the first wave. Shorts align with the trend, so they’re the safer play—focus on 96.995.
Final Vibe Check
This Weekly Watchlist sets you up to trade smarter, not harder. DXY’s bearish momentum is our focus, but patience will unlock the best setups. I’ll keep you updated daily as markets evolve. Protect your capital—max 1%–2% risk per trade, no exceptions. Want the HWC/MWC/LWC guide or another pair? Drop it in the comments! If this watchlist sharpened your edge, hit that boost—it fuels my mission! 😊 Stay disciplined, fam! ✌️
💬 Let’s Talk!
Which setup are you eyeing this week? Share in the comments, and let’s crush it together!

“The Dollar Job: Break-In Strategy for 99+ Profits”💸 “DXY Heist Blueprint: Thieves’ Bullish Breakout Play” 🏴☠️
🌟Hi! Hola! Ola! Bonjour! Hallo! Marhaba!🌟
Welcome, Money Makers & Silent Robbers 🕶️💼✨
This is our next big Thief Trading Heist Plan targeting the 💵 DXY Dollar Index Vault. Armed with both technical precision 🔍 and fundamental insight 📊, we're ready to strike smart — not just fast.
🎯 THE MASTER HEIST PLAN:
🟢 ENTRY POINT – “Heist Entry Protocol”
🎯 Wait for price to break above Resistance @ 99.000 and candle to close ✅
💥 Plan A: Place Buy Stop Orders just above breakout
📥 Plan B: For Pullback Pros, use Buy Limit at recent swing low/high (15m–30m TF)
📌 Tip: Set alerts — don’t get caught napping while the vault opens! ⏰🔔
🛑 STOP LOSS – “Thief’s Escape Hatch”
🧠 Use 4H swing low at 98.100 as SL
⚖️ Adjust based on your lot size and number of open positions
🚨 Don't rush to set SL for Buy Stop entries before confirmation! Patience is part of the plan. 😎
🎯 TARGET – “Mission Objective”
💰 First Exit Target: 100.000
🏃♂️ Optional: Escape earlier near high-risk zones (Blue MA Line Trap Area)
⚔️ SCALPERS' CODE – Stay Sharp!
Only scalp on the Long side.
🔐 Use Trailing SL to guard your loot!
💸 Big wallets? Jump early.
🧠 Smaller stack? Follow the swing crew for coordinated execution.
🌐 MARKET OUTLOOK: WHY THE VAULT’S OPENING
💡 Currently seeing bullish momentum in the DXY
📈 Driven by macroeconomics, sentiment shifts, and intermarket pressure
📰 Want the full debrief? Check our analysis across:
COT Data
Geopolitics & News
Macro Trends & Sentiment
Fundamental Forces
📎🔗 See full breakdown
⚠️ TRADE MANAGEMENT ALERT
🚫 Avoid opening new trades during high-impact news
🔁 Always use Trailing Stops to lock in profits
❤️ Support The Heist – Boost the Plan!
Every boost powers our underground crew 🐱👤.
We rob the markets, not the people. 💼💰
Like & Boost to help grow the Thief Trading Gang 👊💥
Stay tuned, robbers – more heist plans dropping soon.
💸🚀📈🤑

DXY Weekly ForecastDXY Weekly Forecast
- Go for up move if setup given
A Message To Traders:
I’ll be sharing high-quality trade setups for a period time. No bullshit, no fluff, no complicated nonsense — just real, actionable forecast the algorithm is executing. If you’re struggling with trading and desperate for better results, follow my posts closely.
Check out my previously posted setups and forecasts — you’ll be amazed by the high accuracy of the results.
"I Found the Code. I Trust the Algo. Believe Me, That’s It."

DXY Bullish Reversal Setup Toward 98.20 Target Entry Point
Marked at: ~97.200
The price has already reacted multiple times around this level, suggesting it's a key support zone.
🛑 Stop Loss
Placed at: ~96.930
Just below the support zone, protecting against a breakdown below recent lows.
This implies a risk of about 27 pips from the entry.
🎯 Target Point (TP)
Marked at: ~98.201
Strong resistance zone from previous price action.
Target implies a potential reward of 100+ pips, offering a risk-reward ratio (RRR) of ~3.7:1, which is favorable.
📊 Resistance Area
Around 97.419–97.465
This is the first obstacle the price must break through to confirm bullish continuation.
The 200 EMA (blue curve) is currently acting as dynamic resistance, aligning near this zone.
📉 Indicators
Moving Averages:
Red: Likely 50 EMA
Blue: Likely 200 EMA
Price is currently below both EMAs — so trend is still bearish, but trying to shift.
📌 Strategy Insight
The setup anticipates a bullish reversal from 97.200, aiming for a breakout above the 200 EMA and resistance to reach the 98.201 zone.
For confirmation, watch for a strong bullish candle close above 97.465, which would validate upside continuation.
⚠️ Risks
Price is still under both moving averages → downward momentum may persist.
If support at 97.00 breaks, downside acceleration could occur.
✅ Conclusion:
This is a bullish breakout setup on DXY with:
Defined entry and stop-loss.
Clear target.
High RRR.
But it’s crucial to wait for confirmation above resistance (97.465) before full conviction on the long trade.

DXY BANK VAULT BREAK-IN: Your Dollar Index Profit Blueprint🚨 DXY BANK HEIST: Dollar Index Breakout Robbery Plan (Long Setup) 🚨
🌟 Hi! Hola! Ola! Bonjour! Hallo! Marhaba! 🌟
Attention, Market Robbers & Dollar Bandits! 🏦💰💸
Using the 🔥Thief Trading Style🔥, we’re plotting a DXY (Dollar Index) bank heist—time to go LONG and escape near the ATR danger zone. Overbought? Yes. Risky? Absolutely. But the real robbery happens when weak hands panic. Take profits fast—you’ve earned this loot! 🏆💵
📈 ENTRY: BREAKOUT OR GET LEFT BEHIND!
Wait for DXY to cross 99.300 → Then strike hard!
Buy Stop Orders: Place above Moving Average.
Buy Limit Orders: Sneak in on 15M/30M pullbacks (swing lows/highs).
Pro Tip: Set a BREAKOUT ALARM—don’t miss the heist!
🛑 STOP LOSS: DON’T GET LOCKED UP!
For Buy Stop Orders: Never set SL before breakout—amateurs get caught!
Thief’s Safe Spot: Nearest swing low (2H chart).
Rebels: Place SL wherever… but your funeral! ⚰️
🏴☠️ TARGET: 102.300 (Bank Vault Cracked!)
Scalpers: Long only! Trail your SL like a pro thief.
Swing Traders: Ride this heist for maximum payout.
💵 MARKET CONTEXT: DXY IS BULLISH (But Traps Await!)
Fundamentals: COT Reports, Fed Plays, Geopolitics.
Intermarket Sentiment: Bonds, Gold, Stocks—all connected.
Full Analysis: Check our bio0 linkks 👉🔗 (Don’t trade blind!).
⚠️ ALERT: NEWS = VOLATILITY = TRAP ZONE!
Avoid new trades during high-impact news.
Lock profits with trailing stops—greed gets you caught!
💥 SUPPORT THE HEIST (OR GET LEFT BROKE!)
Smash that Boost Button 💖→ Stronger team = bigger scores!
Steal profits daily with the Thief Trading Style. 🎯🚀
Next heist coming soon… stay ready! 🤑🐱👤🔥

DXY - 4H - UPDATEBears tried again on Friday but buyers stepped in and defended the low.
What's next?
If DXY can hold the price above Friday's low, it may set up a bounce.
The R/R is quite attractive. I will keep it on my radar for a potential trade tomorrow.


DXYWe are expecting Dollar to stay weak for a bit longer before we see some reversals. For now it will be going up and down to complete the wave.
Disclosure: We are part of Trade Nation's Influencer program and receive a monthly fee for using their TradingView charts in our analysis.

USDX-BUY strategy 6 hourly chart Reg. ChannelThe index is near the bottom of the channel and indicators are positive.
It worthwhile to look at this carefully, as it will help us in deciding on the other pairs. The current support is a bit lower than the close 97.26 and we can expect 98.30-98.60 area as our objective.
Strategy BUY @ 97.00-97.40 and take profit near 98.50.

DXY JUNE DELIVERY NOTES & NFP week aheadDXY
JUNE DELIVERY NOTES
*June was a distribution candle rebalancing a BISI from March 2022
*daily chart shows price consolidate beginning of June, then mid month breaking to lower prices taking key equal lows, third week price retraces to make a 1 pip high, last week a trending sell off cycle to close the month
*Price is a discount parent range- anticipating a pull back this week for NFP
*Monthly price has broken structure and expecting it to gravitate to the .70 level 96.672 and rebalance the volume imbalance from Feb 2022 for the next coming weeks target ideas
*4 hour chart shows price in a consolidation Thursday and Friday-expansion expected Monday
June 27 DELIVERY
*Price opens in Asia in a expansion cycle to take minor buy side and create a wall of equal highs
*21:00 retraces creates equal lows
*0:00 price takes minor equal highs
*2 London macro price rallies for my suspected equal lows target
*3 macro small retrace of delivery
*7 macro price fake swing to equal lows -creates a wall of equal lows
*9 macro price rallies for equal highs
*13:00 price expands to take session buy stops
*closes retracing to the 50 level
JUNE 30 IDEAS
*I suspect for Sunday's delivery to take minor equal lows possibly the equal lows for a deep discount set up for a buy day- Monday
*last liquidity Friday buy side
*Price is in a deep discount over sold is my thought with the sell off we saw Monday through to Wednesday we could see Price retrace to the 50 level 98.204 for this weeks pull back?
*NFP week ahead parent bias is KING and we are still bear on this pair

Bull Flag on DailyDXY looking bullish on the daily timeframe with a bull flag noticed. Bullish confirmation candles should be looked out and confirmed before placing any long positions

DXY Swing Short! Sell!
Hello,Traders!
DXY keeps falling down
And the index broke the
Key wide horizontal level
Around 97.800 which is now
A resistance and the breakout
Is confirmed so we are very
Bearish biased and we will
Be expecting a bearish
Continuation on Monday
Sell!
Comment and subscribe to help us grow!
Check out other forecasts below too!
Disclosure: I am part of Trade Nation's Influencer program and receive a monthly fee for using their TradingView charts in my analysis.

DXY STRONG DOWNTREND CONTINUES|SHORT|
✅DXY is going down currently
In a strong downtrend and the index
Broke the key structure level of 98.000
Which is now a resistance,
And after the pullback
And retest, I think the price
Will go further down next week
SHORT🔥
✅Like and subscribe to never miss a new idea!✅
Disclosure: I am part of Trade Nation's Influencer program and receive a monthly fee for using their TradingView charts in my analysis.

Dollar Bullish Correction To $103 - $105While we expected to see some Dollar upside in Q2, the economy was in such a bad state that the Dollar could not hold its value. Since the start of 2025 the Dollar is down 12% and this is only the beginning.
I believe we will see more downside in the future. But for the coming quarter there is a chance for the Dollar to get some breathing space & recover in the short term. Overall, the trend of the Dollar remains bearish, so what we want to keep an eye on is small pumps (short term recovery) into price zones which will allow us to short the Dollar back down.
I want to see a dip lower towards $96 - $94 before sellers lose bearish momentum. If this move takes place, then we can slowly see buyers step back into the market & start pushing back to the upside. Once price hits our ‘Supply Zone’ of $103 again, it’ll give us a more clear indication of what the Dollar will do next; whether that’s a longer term uptrend or a continuation to the downside.

DXY ANNALSIS OUTLOOK BULLISH POSIBLE MOVEWS 28/6/2025strong buy 97.000
buy 96.800
going on bullish moves
buyers and sellers
ready to new months new week's
buy 97.000
take profit 97.400
take profit 97.800
take profit 98.500
stop los 96.600

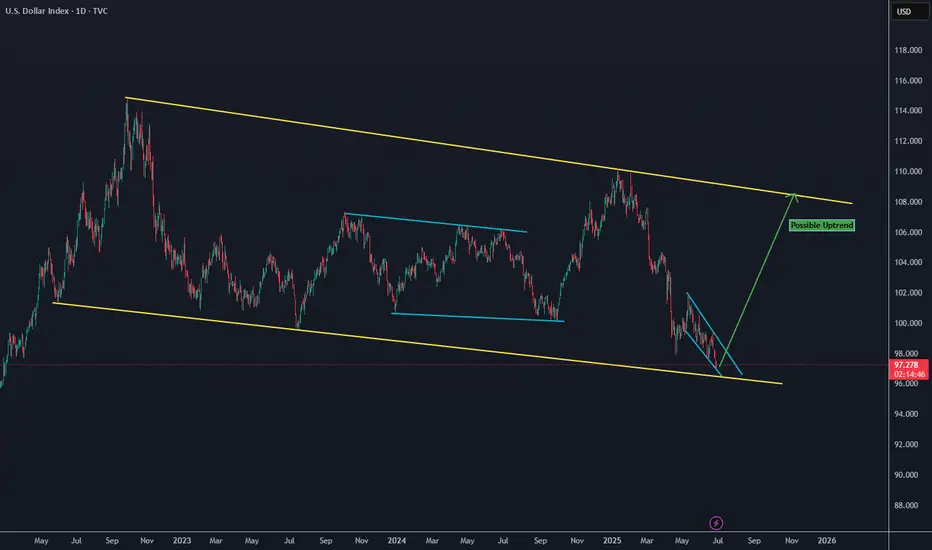
US DOLLAR INDEX BOTTOMING?DXY looking for bottom and reversal around 97.
possible target : 108+
stop trade below 96.
good luck.

Make Dollar Great AgainDXY Big Picture
While looking at other DXY charts to use a clean chart for HTF, I saw that it touched historical trend support. It didn't touch only on the TVC chart, so I am adding it with the other charts and accepting that it touched the trend.
According to the fractal I added in August last year, the price is moving very well.
I expect a correction from these areas. I think we have reached the reversal areas due to both the momentum in the declines and the oversold.
The decline fatigue I mentioned is more evident in LTF charts. The price cannot reach the EQ zone of the decline channel that has been going on since February on the daily chart. Although it is a very inclined channel on the 4h chart, it can no longer reach the channel bottom. For this reason, I think this region is where reversal should be sought. After the first 0.38 of this decline, I think a pullback to 0.5 is possible.
