KLSE trade ideas
KLSE WILL REVERSAL SOON?? WHEN BULLISH ENGULFING??IM WAITING FOR ANOTHER BULLISH ENGULFING.
BUT SPOTTED SPINNING TOP CS?? REVERSAL WILL HAPPEN SOON ??
ALSO MONITOR OF MACD INDI, CROSS LINE(IN CIRCLE)
..Support Tun M:. ;)
IF THE REVERSAL HAPPENED, EXPECTING MANY COUNTER WILL PROFIT.. MORE MONEY TO COME
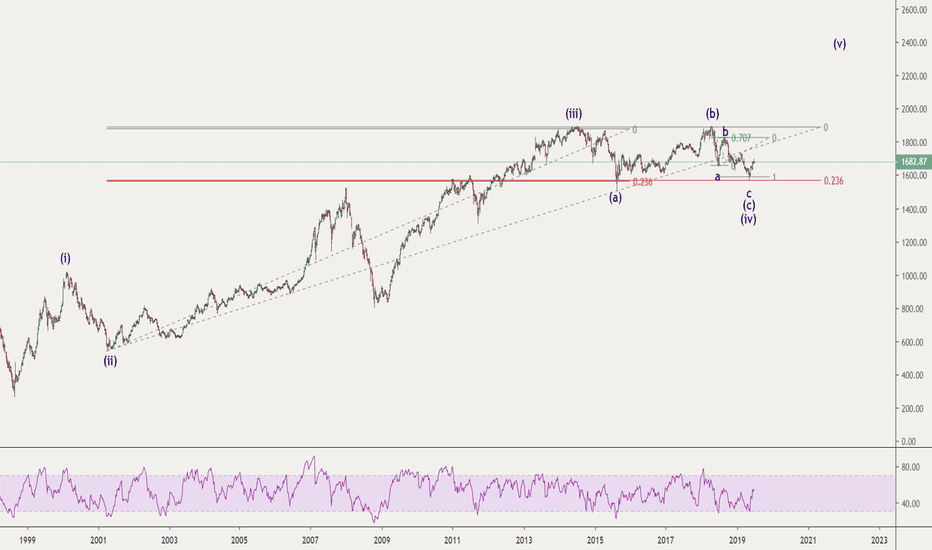
KLSE WEAK PERFORMANCEMy previous analysis based on EW was right at the first place when it bounced at the last 'Z' wave during its correction moves. However, after it manages to rose 8% from the previous low in the Z wave, it started to plummet down and now it has made a lower low that passed the previous correction wave. Based on my Monthly chart analysis, what I see was it is still heading to the final correction wave, which it might take 1 to 2 years before the economy recovers.
KLCI - Hovering at a critical levelKLCI index have a low beta compare to other indexes in the world, as negative sentiment affecting the world markets might not be as impactful to KLCI but do note that KLCI is a critical level, anything below 1572 we will likely go back to find support at 1500.
Recommendations:
- Reduce the number of stocks in your portfoilio until we see some buying back in the market
- Secure profits if you have to
- If you have to, be selective of the stocks you choose, such as industries and trend
KLSE; Bull or Bear Market in the making? Hi everyone, how’s everyone doing?
My current thoughts of the current KLCI.
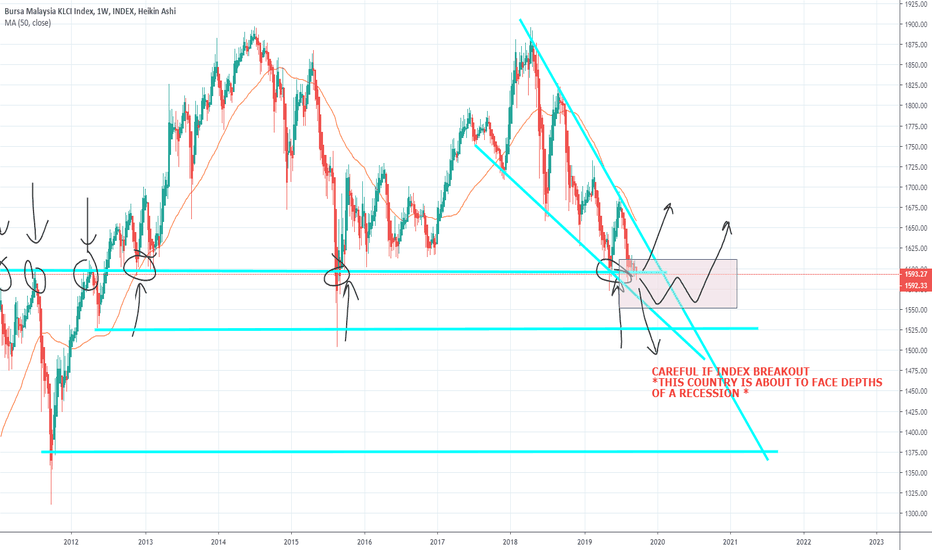
1. I’ve been watching the KLCI for awhile now, and it seems like we’ve been in this falling wedge pattern for quite awhile now.
2. Writing this at August 5 2019, The chart is telling us that we’re heading for more downward action in the next few weeks.
3. My thoughts are that a possible long entry in the index or the general market would be when the index hits the support line of the falling wedge.
4. And once we rebound from that support line, we will have a short rally before the cycle repeats itself, until we have a strong bullish breakout from the falling wedge, or a bearish breakout that would send us to lower lows and test the previous support levels which are shown in red.
5. Given the current market sentiments, the likelihood for a bearish breakout would be more probable.
6. Most stocks in the energy and construction sector ( i have been trading these sectors for the past few months) have already reached overbought levels.
7. Looking at the current US China trade war, We’ve had a false breakout from the falling wedge. Possibly due to the hopes of interest rate cuts from the Fed in July 2019, which was quickly shut down by a tariff imposed on Chinese goods.
8. Great buying opportunities lies ahead for those who are waiting for an entry into the market.
9. You know it’s the right time to buy, when your friends who normally flex their holdings aren’t doing it anymore.


