Kadar kenaikan 2 bulan yang lepas bagi indeks FBMKLCI kekal utuhFBMKLCI kini menunjukkan penurunan nilai yang kecil di bawah bacaan 38.20% dalam Anjakan Fibonacci. Secara teknikal, ini merupakan tindak balas yang normal berikutan pemulihan nilai yang dapat dilihat dalam empat sesi yang lepas.
Walau bagaimanapun, selagi tiada tanda kemerosotan yang signifikan, kami percaya bahawa kenaikan indeks selama 2 bulan ini masih lagi menunjukkan tanda-tanda yang memberangsangkan. Carta menunjukkan nilai sokongan terhampir di paras 1,700 mata, diikuti oleh rintangan segera yang berhampiran garis aliran menurun pada sekitar paras 1,750 mata.
Bagi tinjauan jangka masa pendek, pengunduran kecil adalah normal di bawah paras 38.20% Anjakan Fibonacci. Manakala bagi tinjauan jangka masa panjang, kami anggarkan sentimen pasaran akan bertambah pulih. Anggaran ini disokong oleh corak "Perbezaan Positif", yang mencadangkan pembetulan harga baru-baru ini bakal berakhir.
Untuk maklumat lanjut, sila layari laman sesawang rasmi kami di:
menangsaham.com
telegramddnk.com
KLSE trade ideas
FBMKLCI: Hari Pertama yang merisaukanFBMKLCI di buka tinggi pada permulaan dagangan tetapi telah di tutup hampir pada paras terendah harian 1668.11 turun -25.4 mata. jika trend ini berterusan, ia amatlah tidak baik untuk FBMKLCI, jika indeks di buka esok di bawah paras 1670, maka FBMKLCI sekali lagi jaruh di bawah paras sokongan garisan arah aliran dinamik. apa yang merisaukan ialah, jika ia berterusan jatuh, ditambah pula dengan momentum yang besar dan kuat, ini akan memungkinkan indek telah jatuh di bawah neckline corak head and shoulder, dan paras sasaran berikutnya adalah berkemungkinan di bawah paras 1300 kalau mengikut sasaran X2X.
Untuk itu, saya suka mengajak para pelabur dan pedagang untuk monitor saham saham yang mempunyai market capitalisation yang tinggi seperti PBBANK, MAYBANK, TENAGA dan PCHEM untuk melihat kemana kah arah tujuan indek semasa. Ini adalah kerana jika Indeks betul akan jatuh, maka, saham saham yang mempunyai market capitalisation yang besar inilah yang akan menjadi penyebab kejatuhan FBMKLCI.
December Always Positive for indexsSetiap tahun KLCI akan di tutup positif pada bualan December. Kecuali pada tahun 2014. Pada tahun 2018 ini, nampaknya KLCI akan di tutup positif juga.
Kebiasaannya ianya akan terus positif sehingga hari raya Cina. Indeks cuba untuk melepasi paras rintangan 1780 dan akan di tutup di atas 1700 mata sebelum 2018 melabuhkan tirainya. InsyaAllah
TECHNICAL ANALYSIS ON KLCI TIMEFRAME MONTHLY!Dear Trader / Investor,
From my view in time frame Monthly on KLCI, I saw a downtrend in a couple of months before it will go uptrend.
the first things we have to wait until the point trigger on support 1 zone and I will consider it to buy call followed by the trending sector (uptrend)
and we will use 50% of current balance on support 1 zone + correct money management 1:2 or 1:3
trade at your own risk!
Bursa Malaysia KLCI Index Although investors remain cautious about recent gains, DBS notice that Malaysia's fundamentals have not involve any negative news. The simultaneous growth of the global economy and the rebound in corporate earnings will continue to support the stock market. The strength of this benchmark index is mainly from the rising bank stocks, as the earnings outlook is still good and the Bank of Malaysia raises interest rates.
FBMKLCI - Consolidation in a downtrend.Greetings to all.
The Bursa market has taken a hit from what it seems a short rally with 2 day gap up on 16th Nov and 19 Nov. Then the Bursa is closed on Tuesday on public holiday and the next day (Wed, 21st Nov) the market opened with a gap down and plunged -15.34 pts (-0.9%) on bad sentiment from the US and Crude Oil bad movement the day before.
Here is my latest update on the technical review for KLCI.
1. It is clear that the index has been on a short term downtrend ever since a short rally ended with a peak somewhere in late August 2018.
2. Since that moment, the index is giving out negative technical signals such as;
a. lower highs and lower lows,
b. breaking the long term EMA 200 support
c. candlesticks turning yellow which gives a confirmative negative trend signal
d. since the yellow candlesticks appear, it has been a steep decline thereafter.
e. currently a chart pattern, a consolidation in a downtrend, "bearish pennant" is spotted with a crucial support around 1672 - 1681. If the price breaks
this support and stays below, the next short term lower target (based on the fibonacci key levels) is likely to be 1658 and 1641.
Based on Fibonacci Key Levels,
Current immediate short term support of the index = S1 - 1681, S1 - 1672
Current immediate short term resistance of the index = R1 - 1708, R2 - 1736
Cadangan Sell bagi KLCI Jangka Masa Panjang.Pasaran KLCI mengalami penurunan yang teruk sejak peralihan kuasa dalam PRU baru baru ini.
Market hate uncertainty berdasarkan beberapa isu yang disuarakan oleh kerajaan yang mentadbir.
Untuk mengembalikan keyakinan para pelabur, diharapkan agar kerajaan mengeluarkan cadangan yang memberikan sentimen positif untuk KLCI dan fokus untuk menaikkan KLCI ke arah Bull Run. Cadangan capital gain tax tidak bagus untuk pasaran dan sudah pasti ini membuatkan pelabur akan beralih minat kepada pasaran negara lain.
Secara jelas buat masa sekarang, KLCI akan meneruskan penurunan ke paras seterusnya sekitar 1600 mata. Tetapi correction harus ada sebelum penurunan.
Dinasihatkan para pelabur menguruskan portfolio pelaburan dengan hemah.
Bull Momentum Building.Highlight - 3rd Aug Balance of Trade for Jun.
Emerging Market such as MARVEL (Argentina), BOVESPA (Brazil) & JSX COMP (Indonesia) are among the choices for investor to invest their funds this past week. & among the top gainer in those market are tech & telecom companies.
I wouldnt be surprise should Malaysia show a solid balance of trade report this early August, more investor will be pouring their fund in this undervalued market because of the general election & scandal.
Also look for solid report from DIGI, MAXIS & AXIATA which will carry on the bull momentum.
Technically,
it still is dime. but we can see bull momentum are building with its breakout above the 50ma.
There is also a visible double bottom. Should everything go as planned, we would have a classic head & shoulder reversal pattern.
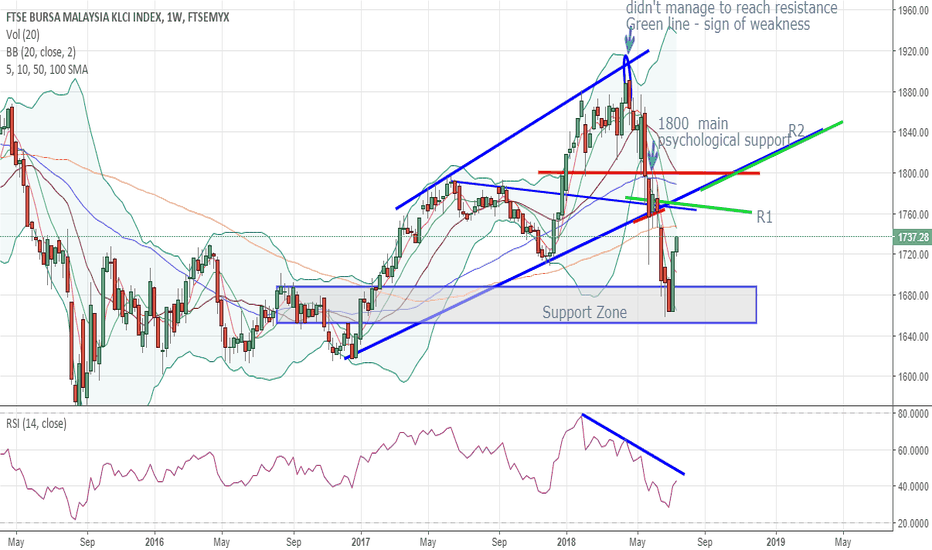
FBM KLCI weekly chart - short term reboundKLCI staged a breather from a sharp drop since early May after failed attempt to break and close above 1900 level. Short term uptrend with Resistance set at R1 and R2, if momentum continues, might signal a comeback. But for now, bearish trend still in effect.
FBMKLCI heading south for FLAT CORRECTIONCurrent downward movement of FBMKLCI suggest that the corrective wave are still intact. 5 subwave sequence of wave C in the making. Index falling to complete the subwave iii of wave C.
Possible target for wave iii : 1650/1600
Possible target for wave C : 1550/1500
FBMKLCI in the midst of completing a flat correctionBased on the wave structure, FBMKLCI completed 5 waves leading diagonal from 2009 to 2014.
FBMKLCI embarked a correction in 2014, and the pattern is still unfolding.
Based on the recent retest of historical high in Q2 of 2018, it is finally apparent that the rally from 2015 bottom was a wave B of the overall flat correction.
Since the internal structure of flat is 3-3-5, expect a 5 wave decline to unfold, before concluding the current flat correction.
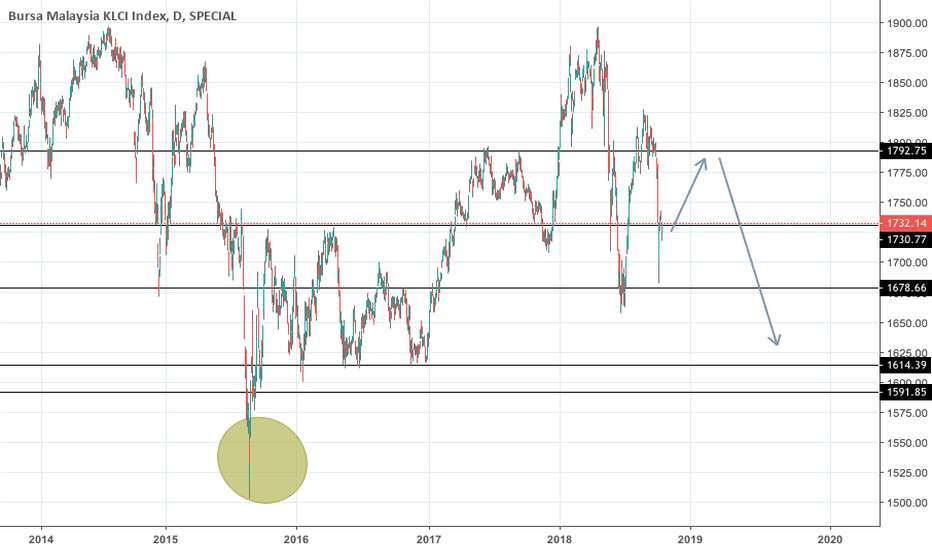
Further correction for KLCIKLCI might do a further correction since the breakout of the previous support at 1791 point. The next support zone is 1756 point . Overall, KLCI still in the uptrend bias. However, 1756 might be a turning point for bearish momentum. The other support zone is at 1707 point.
24 April 2018 post


