MMTH 50%MMTH with 50% limit. When the MMTH is below 50% it is likely that there are tensions in the market.
MMTH trade ideas

Weekly Outlook Sep 2-6 (Breadth Indicators)In the top chart we have INDEX:MMTH which shows how many stocks are above their 200 D MA expressed as a percentage. When 70% or more of stocks are above their 200 D MA, it can be seen as over exuberance which can lead to a short term decline as investors take profits on riskier stocks to rotate in less risky stocks. While we are not quite there yet, the middle chart INDEX:MMFI (stocks above 50D MA) and INDEX:MMTW (stocks above 20 D MA) show cause of concern for short term downside.
The above market breadth indicators can signal a rotation out of risk. When combined with other indicators such as market fear/greed being neutral, AAII sentiment being 2% off its 1 year bullish high, its likely we will see a rotation out of risk such as crypto - paving a short opportunity for risky assets in crypto (political tokens, meme tokens etc)

next big move yet to come percent of stocks above 200 ema going strong .
means more participants are joining the rally.

Time for SPX to decide whether consolidate or notIf the data hold above the lower line, it is really to stand out

Percentage of stockspercentage of stocks above 200 moving average .
we are getting into a big bull run .
2023 for sure a mega bull run .
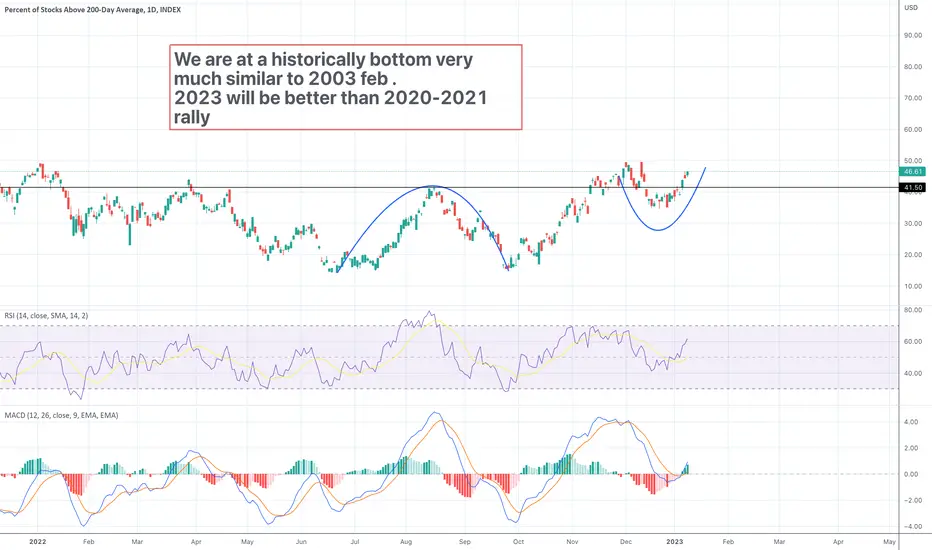
percentage of stocks above 200Ema . Big rally in 2023we are in 2022 and much similar to 2002 bottom .
history repeat itself.
a bigger rally in 2023 , much much bigger than last few years.
followed by a correction in 2024 for few months and then rally will resume.
the age of bear market is over .
more fear leads to bigger bull market

MMTH, about to pull above our yearly high ( 49.17% ) I consider this an indicator of market breadth . Ignore pundits telling you their doomsday predictions and see that stocks above their 200 sma is :
In a stage two uptrend. More confirmation of this needed, could also be a stage one if we don't see follow-through here and pull into a sideways range which would then be back into stage 1 .
Either way , its no longer in stage 4 ;)
Has made a major higher low and a major higher high
Is above its 200 ema which is angled up , ma's are beginning to stack with 10/21 emas overtaking 200 and 50 sma on its way , all angled UP
Is just below the yearly 2022 high of 49.17
Bull market ~

Good indicator buy zone of overal arketWhen the candle is in the green sector their good chances to be in a good enter a Long position. INDEX:MMTH

General Market Buy Zone IndicatorThe market can go downside but not much longer than a year. It can go side for much longer.
Patient before entering. For example, it can go deep as 0.7 before a V shape.

U.S. markets up from here? Percent of stocks >200ma is rising.The vertical lines match $SPX lows with times when only 15-20% of stocks traded over their 200ma. The light blue line is a 10-week moving average and you can see that once it turns up it keeps rising (2008-09 was an exception). According to this broad market indicator, stocks have been performing better since early July.
This is a big picture view, not to be used for short term trading. This index is a useful way to evaluate overall market condition, especially for active investing decisions.
Considering this index is closer to 20 than to 50, it is possible that even if stocks are broadly sold again, there will soon enough be a substantial rise in stock prices. The exception to all of this - if "this time is different" is true. If all the Covid-induced money printing has damaged the system so much that worse extremes will be needed to make amends, then the usual historical patterns may all go out the window.

Stocks above 200 day MAThis chart shows that pretty much the best point in the history of the stock market to buy was in the first half of 2009. Returns since that low point during very turbulent times for the economy have been phenomenal. The chart here shows that there was indeed a very clear signal that investors could have seen in that this metric of % stocks above 200 day MA skyrocketed in early 2009. Inversely there was also a failure to break above the area drawn that signalled a return to the bear market in 2008. The current situation looks like we could be in a similar place. Certinly a chart to keep an eye on.

% of stocks above 200 moving average (SPX)This indicator anticipated the fall of the SPX well in advance, according to the yellow line on April 12, 2021.
Showing a clear divergence.
As SPX went up, the indicator went down.
Only on January 10, 2022 was there a trend reversal in SPX, going down.
Now the indicator appears to be anticipating a rally.

% of stocks above 200 moving average.no matter what happen in the outer world , stock market always behave very different to the information forecasted.
we are entering into extreme fear zone and a huge buying is already started . some stocks are already resisting new lows which is a positive sign .
stocks always form bottom first compared to market.
$SPXWhen % stocks below 200 SMA (blue) reached the level of the horizonal purple line, it coincided with a bottom in $SPX (yellow) previously.


Where are we going? Seems a lot more like a 2008 relief bounce..Let's face the reality, there was a lot of pain those weeks, isn't it?
I was checking MMTH and find some useful ideas.
From MMTH we can understand the health of US Market. Actually we have only 20% of company above 200 average.
2008 showed us a similar situation with a long dump and increasing fear in stock market.
However we see clearly a DeadCat jump exactly in May followd by two major dumps.
2022 Looks quite similar, only little shifted.
A copy paste from 2008, can give us some trigger moments
Pump from half May to half Jul
Dump till December
5 Month for accumulation
I like to make compare between graphs as check :
Back in 2008 UsOil pumped from 95$ to 140$
Now UsOil arrived at 100$. A friendly reminder is to keep in consideration we are heading thru storm season from around August, and usually the best place for storms are exactly on Gulf of Mexico Area. If market will try a rebounce Crude will jump even higer, and when reached the top, storms will complete the rising spike pain. In the worst case it really can reach 200$ /brl... not so good, isn't?
Let's find other indicators...
DXY give some more hints. It spiked a lot on late 2008.
DXY is already spiking now. This can shift our DeadCat Bounce idea in a more Bullish idea. Maybe we already reached the bottom and we must wait 5 month to recover?
If DXY will playout fine, this means we are heading for about 5 month accumulation and from October/November market will pump.
And as further compare
Natural Gas is the perfect Crisis indicator.
Prices for Natural Gas go up longer than Crude. Only when Natural Gas will start to dump costantly, than the game is finished.
I think this can be usufeul for today.

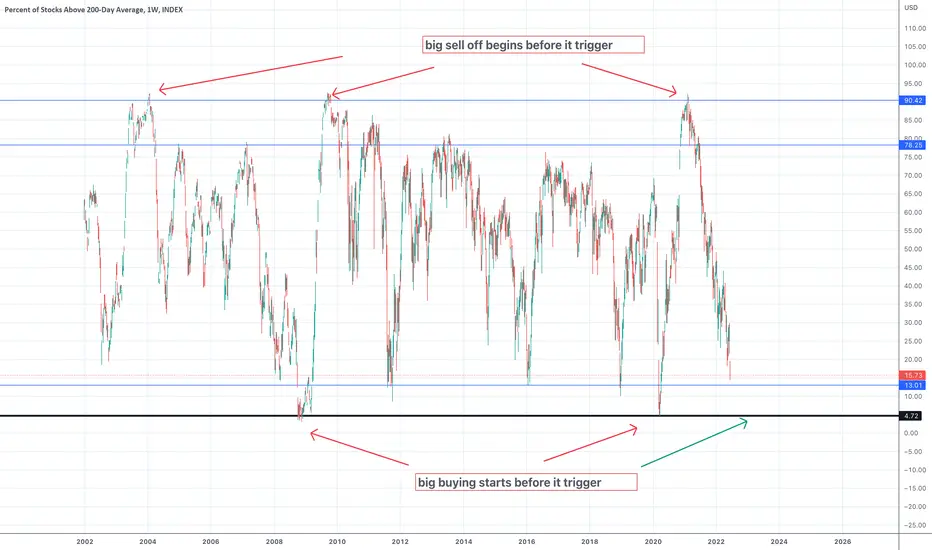
Stocks trading above/below 200 MAChart shows a historical reversal line when in a bear markets. When only 13% of stocks trade above the 200ma, this signals the beginning of a bull market.

Historic Chart Data 200 MAHistoric data of stocks trading above/below their 200 MA. Jan '21 almost 90% of stocks traded above their 200 MA. Currently, 32% of stocks trade below their 200 MA. Although this downtrend is likely
to continue. Historically speaking, stocks could see a reversal of the trend in the next 3 to 12 months.

more than a dip, not quite cheap $qqq $spy $vix $vxx MMTH, The percentage of stocks over their 200 day moving average, is a useful tool for clues of the broad market technical trend. Combined with vix volatility index, which measures option premium of at the money options (implied moves), we can get confirmation of changes prices and sentiment. Vix is also called the 'fear index'.
By looking at the chart made here, we can see that the extreme lows in MMTH and extremes highs in vix volatility were major buying opportunities. We also observe the tiny dips in a uptrend that were also minor buyable opportunities. The most difficult part of decision making is determining if current selling is a small dip to be bought or a larger correction to be avoided until concluded.
I dont know if the selling is over, but I do observe that this was not just a tiny buyable dip in the bull trend. I will standby and wait for upside confirmation due to the risk. Especially since fundamentals mark the sp500 above the averages values of 1.5x price to sales and 15 price to earnings, we should be more cautious than greedy when technicals are unclear.

Breadth Reading Top-Out on February 2021 Breadth readings are important to how many pillars are available to support a building. From MMTH or "Percent of Stocks Above 200 Day Moving Average", we can easily see it tops out on February 2021. It keeps going down from 90% to 30% now.
But, a few mega stocks overweighted the index like AMZN, AAPL, MSFT, GOOGL, FB, TSLA, NFLX distorts the picture where we only see the new highs even up to the beginning of 2022, only three weeks ago.
However, when these mega stocks are no longer rally or tumble (NFLX -20% today) we will see there are not much support available for the indexes. It is still early stage of the beginning of bear markets. So please prepare accordingly.

MMTH - % of stocks above 200 DMA1) Since 2000 % of stock over 200 DMA > 89% - 92% in 2002 ,2009 & 2021 happened only 3 thrice it always came back to 45% after that,
) After that either it consolidates in this area or moves back to 70 & consolidates so we have couple weeks to be in that before going in either direction mostly in lower 30 to upper 2Os which can reverse the market ,

nasdaq crash expectationwe see a big divergency between the Nasdaq indice and the precent of stocks above 200-day average: Nasdaq indice countinue to go up but the majority of stocks are decreasing roughly .
--->basing on the channel we got , if the MMTH break the channel it's sign with a big probabilty to coming downtrend

SPX500 and MMTH : a lovely correlationSPX500 and MMTH : a lovely correlation.
Enjoy the beauty.
No needs to say more, DYOR and peace
