NDTH looking for some reliefThe NDTH is a chart of the percentage of Nasdaq 100 stocks that are above their 200-day moving average.
This chart, although looks like driven by fundamentals - has created perfect tops and bottoms to be able to chart it. We have re-touched the bottom on the midterm and value is still withing this descending channel - but all looks like in favor of some relief by breaking out to the upside. More companies from NASDAQ index could go above their 200-day ma before going finally down again.
NDTH trade ideas

Tech is at a Significant BottomI'm surprised that no one on Trading View posted this chart today.
The NDTH is a chart of the percentage of Nasdaq 100 stocks that are above their 200-day moving average. It dropped to 6.86 today. This means about 94% of Nasdaq 100 stocks were below their 200-day moving average. The last time this level was reached was in March 2020 right at the bottom of the COVID market crash. The NDTH has never dropped below 15 except during significant bottoms on the Nasdaq.
While anything is possible, it's highly likely that we are seeing peak fear, peak inflation, and market capitulation currently. This extreme level makes for a very good risk-to-reward setup for going long. My strategy is to place a 2x daily ATR stop loss on QQQ or TQQQ. It's likely if we drop below this level then we're in for a deep recession. Whereas if this low holds, then this is a major bottom for tech.

Keeping It SimpleThere's so much going on right now, but I think this chart sums it up for assets in general. This is a fairly simple idea I fantasized a while ago and it played out to my surprise. Every once and a while, the percentage of bullish stocks doubles, and then a selloff happens. Unless we can break this symmetry and make a clear break above 25, we should not expect anything special. It's easy to fomo in but possibly the best move is to move to other markets.
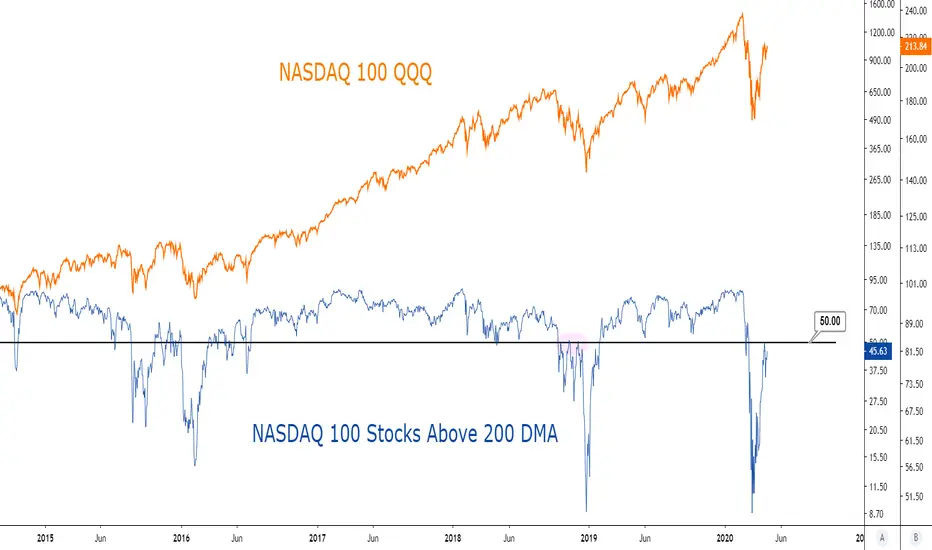
Also note the severity of the 2020 dump, before being launched by money supply expansion, among others:
We did not yet meet the level of the 2020 crash. Also, there is no money supply expansion this time. So, what would have happened in 2020 or perhaps 2008, should really happen this time, unless of course there is more money supply expansion.
Cheers and don't forget to hedge your bets!

NASDAQ 200 above - RSI breaking outThis is bullish.
The weekly RSI just broke out.
Tech stocks will do very well in the next couple months.

Nasdaq 100 Stocks Above 200-Day Average - CHECK RSI!When the RSI breaks out, it's BULL RUN time!!
The Nasdaq has been destroyed! It's time to get a relief rally!

Historic long signal here for stock marketsThis is not a one stop signal - but it does give some confluence that odds are a bounce or bottom are coming either her already or soon. However the macro conditions with recession/depression here plus QT and rising rates and supply chain issues paint a different story. Which is it?
I suspect we have a lot more pain ahead next 24 months to 8 years of this Fourth Turning but there will be rip-yo-face off rallies in between
You make the call!

Nasdaq 100 Stocks above 200 MANasdaq 100 Stocks above 200 MA.
Probably this is the slowest downfall ever since the 2008 Crash. We are right now at 2011, 2016, 2018 and 2020 levels

NDTH "Buy the dip!" back testWe are entering NDTH levels that have suggested bottoms of the market in time. Backtest
2008
2011
2016
2018
2020

VX Contango + BreadthVX2/VX1 Looking at Extremes in the Slope of the VIX Futures Term Structure overlayed on my Breadth Chart.
This is just to show how the signal works with the breadth chart I use to illustrate how complementary Simple Breadth + Vol Metrics Can be for Long Term Buying/Selling.

sizable stock market bounce coming by May 31Looking back it's hard to find a time when this wasn't the leading best signal for a sizable rally in stock markets (and likely crypto will bottom ahead of this bottoming out). Just have to wait for the break of the downtrend.

Long signal for equities next bounceGreat place to long equities is on next area or trendline test of support of NDX strength charts reaching way oversold bearish sentiment soon

NASDAQ price compare to NASDAQ stocks above 200 day averageAn interesting comparison between the nasdaq (log) and the number of stocks in the nasdaq above the 200 day average. It seems to me that any time the number drops to 30 or less (into the red channel), then within the coming months continues to correct further until only 7-12 stocks are above the 200 day average. It looks like this last around 1-2 months before it things improve (2008 as the exception at 5.5 months).

Do you see what I see?The scale is from 0-300. Combines the Russell 2000, Nasdaq, and S&P percentage of stocks above the 200 day MA.
Looks like the market should take caution if you take into account the trend of inflection points...
Good luck and hedge your bets!

Nasdaq BreadthA look at NDX Breadth via observing % of Stocks Above their respective 20, 50 & 200 Day Moving Averages.


NDTH: long-term trend (slipping off the edge of the cliff?)NDTH’s long-term trend chart is presented. ____
Prompt: New traders should take some time and carefully read the post entitled 'You can't beat the market' that is located in my profile.
Disclaimer
The author of this text is not an investment advisor. The preceding content is intended to be used for informational and educational purposes only.
It is not an advice or inducement for the purchase or sale of the products mentioned. Before making any investment based on your own personal circumstances,
it is very important to do your own research and analysis and also take independent financial advice from a professional to verify any information provided here.

NDTH: mid-term trend (standing on the edge of the cliff)NDTH’s mid-term trend chart is presented. If you did not know the NDTH index, it is advisable to learn it
and monitor it because it will help you understand what phase the market is at any time,
in combination with other indexes and indicators of course.
Prompt: New traders should take some time and carefully read the post entitled 'You can't beat the market' that is located in my profile.
Disclaimer
The author of this text is not an investment advisor. The preceding content is intended to be used for informational and educational purposes only.
It is not an advice or inducement for the purchase or sale of the products mentioned. Before making any investment based on your own personal circumstances,
it is very important to do your own research and analysis and also take independent financial advice from a professional to verify any information provided here.