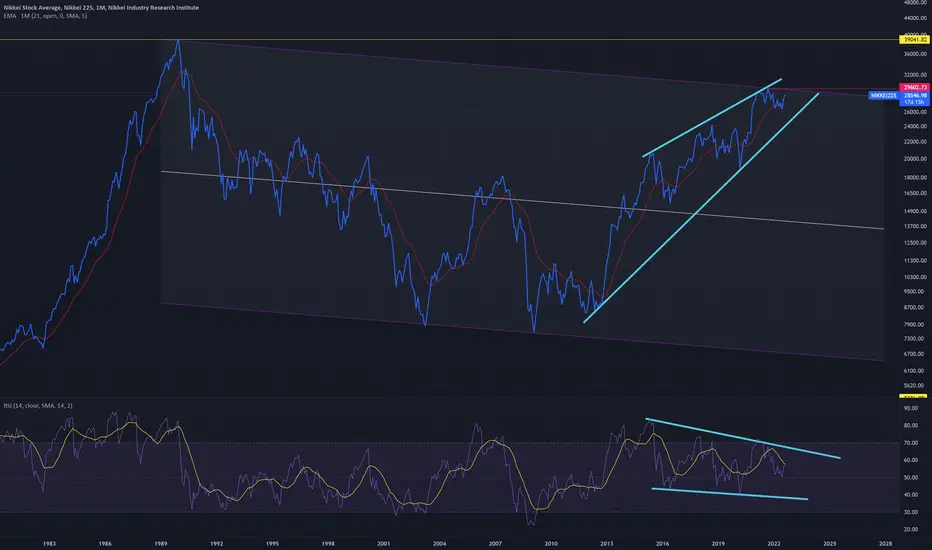
NI225, Elliott wave analysis■Outlook of NI225 on 3D chart.
We are probably in the B-wave shown as green line.
The B-wave chart pattern is probably Triple three WXY.
The W-wave is Regular Flat.
The X-wave is Zigzag.
The W-wave greatly exceeded the A-wave's Fibonacci level of 61.8%.
The B-wave on upper degree may have reached the target price already. From now on, Only time may be updated.
For the above reason, I think Y-wave is probably a Triangle pattern.
Last time my idea.
■Jan 9, 2022. Long-term analysis.
NKY trade ideas

The Nikkei considers a bounce ahead of the FOMC meetingThe Nikkei 225 has fallen sharpy towards (yet held above) the September low. A small bullish hammer formed on Thursday to show a loss of bearish momentum, alongside a false break of trend support. A bullish engulfing candle formed on Friday and closed above the 100 and 200-day EMA's. Its low also respected a 50% retracement level and closed back above trend support for a second consecutive day.
We therefore suspect a bounce is on the cards, although as markets are wary of the upcoming FOMC meeting we are also aware that any such bounce may limited, so traders would be wise to keep a close eye on price action and not expect oversized moves, unless a new catalyst arrives.
Low volatility retracements within Friday's candle could help to improve the potential reward to risk ratio for bulls.
A potential bullish outcome for equities in general is if the Fed surprise with a less-hawkish-than expected hike. We know 75bp is mostly priced in, so if they hint at a slower rate of hikes going forward, equities might be able to cobble together a relief rally. Whilst a hawkish hike would likely present indices with swing highs and another leg lower.

JP225 Nikkei Ready to Fall to 25745Multi Timeframe Analysis
Hint: A massive bearish order block at 26809 is being statisfied. Price will then crash to to a fibonacci level that coincides with a bullish order block
JP225's recent surge is ending. We see price's bullish run hit a massive bearish order block and wicks are freebly forming
Medium term bearish Narrative:
1. Bearish institutional order block now satisfied. Price gravitates to such market imbalances. Drop is inevitable to one of the fibonacci levels.
2. Bullish order block at 25745 awaits satisfaction
2. Bearish divergence signals on the daily and 4H
3. TDI calling for retrace
4. Overbought on daily and volume flow in extremes.
5. Price is wicking up, signifying diffculty to ascend further.
6. Bearish Anti Butterfly Harmonic Pattern
Await a confluence signifying a drop, then take a satisfying short
Remember: life often disrespects charts so trade with caution
------
Market order position upon the confluence of valid entry rules on the 4H or 1H chart.
-=ENTRY RULES=-
Trading philosophy: Don’t short at the lowest of the bearish momentum nor do we long at the peak of a bullish impulse. The safest entries are at the end of a retrace on the 38.2%, 50%, 61.8% or 78.6% fibonacci back in the direction of the master trend.
Note: I use Daily/4H or 4h/1H market structures with wave analysis to prep for potential entries. The RSI , MACD and EMA indictors are confirmation for entries at the 4H or 1H timeframe
For ORDER BLOCK trades:
When price reaches a bearish or bullish orderblock, ascertain the price reversal by means of
1. Dojis
2. Morning/evening stars
3. Several wicks.
4. Engulfing candles or three white soldiers in the opposite direction
5. Marbouzou in the opposite direction.
6. Break of trendline or fast EMAs
For SHORT:
4H chart should confirm that the bullish retrace had turned bearish in the direction of master trend. The MACD should have dropped below zero signifying a bearish environment. Price would have dropped below the 10 and 20 EMA . For good measure, check that the 4h and D1 RSI is below the 50 signal line
For LONG:
4H chart should confirm that the bearish retrace had turned bullish in the direction of the master trend. The MACD should have gone above zero signifying a bullish environment. Price had gone above the 10 and 20 EMA . For good measure, check that the 4h and D1 RSI is above the 50 signal line
Divergences:
The 4H, 8H and 12H chart can reveal hidden divergences on the RSI , MACD , Money Flow Index, CMFI, On Balance Volume and Stochastics. When one or more divergences manifest- be ready. Trend reversal is coming. My best practice is to wait for at least an RSI divergence on the 4H, then drop to M15 to see price shifting with a 50EMA aligned with the 4H divergence.
About me
I am not a financial advisor nor a signal provider. These are the opinions of a 20-year private trader in the legal profession as well as a businessman diversified in the tech and hospitality industries. My favored tools of the trade include wave analysis, price action on the 4H to Weekly timeframes and institutional order flow ( COT data).

Japan 225 Short M15, M30, H1 and H4 are overbought
There has been a lot of consolidation and structure
No pattern and its against the trend
250 pip stop loss

Nikkei returns in EUR vs the EURJPYCorrelation has rock bottomed and is expected to reverse - EURJPY shorts could work as a hedge for Nikkei positions in EUR.

Europe&Japan to perform better than USA from now on, 2-JapanComparision of "NIKKEI in USD dollars" to "SPX".
I am publishing the same for all (please see my other analysis): Germany, UK, France, Italy, Japan...
I ignore all the fundamentals and just make technical analysis . Fall of EUR&GBP&JPY and their stock market's negative divergence compared to USA (SPX) is about to end, I believe.
Important: This doesn't mean that the equities&indices are going to rise from now on. My analysis only says: Europe&Japan will perform better than USA. Just because they are very cheap.

NIkkei 225 10 year ProfileBOJ intervened for the first time since 1998, to prop up it's the YEN, with some speculation they likely sold a lot of their massive reserves of long end (10-30 year) US T Bills to buy back the Yen. This hypothesis appears supported by the lack of short end yield movement at 4-5a, EST at time of BOJ intervention announcement late last week. Of note in this chart are:
- Almost a decade long volume profile aligned with vPOC at 382 retrace.
- Structure of current price action seemingly mirroring the covid structure as represented by the fractal in light blue above.

NIKKEI225We expect the adjustment to begin in October 2019 and bottom out 55 months later, around May 2023.
This is reasonable when looking over the WXY wave from a time allocation perspective.
The target price for the bottom of the double-three is likely to be either around 14300 yen or 20,000 yen.

Japan 225 Watch for breakout to keep falling Hi there,
JAPAN 225 is breaking down.
Watch for this breakout to keep falling all the way back to the bottom.
Good Luck

Nikkei Index 4-hour Chart starts SELLIt shows bearish pinbar closes at 27163. This level is used to entry SELL with Stop Loss at 27270.90 and Take Profit at 26777.40.

EW bear market cycleThe above chart will clearly explains that the NIKKEI {and other world indices follow through} will correct for its final phase of correction(5 wave bear market) untill 2030.
japan is a well developed country with highest debt/gdp ratio

JPN225 Range ShortTrade on Chart for RANGE of JPN225.
Shorting at Supply Zone can provide a favorable RR.

JP225USD $JP225USD Initial LongJP225USD $JP225USD Initial Long. This is a pure momentum signal just as are every other signal I post. ZERO other factors are considered in producing this signal.
Entry reasons: JP225USD is showing momentum and confluence of mean reversion crossing up the 70 day price mean.
Exits and SL: TP and SL on chart. Move SL on TP. After TP2, trail with 0.5xATR step and 1.5xATR offset.

jp225usdAS shown in the graph. Parallellism I guess? Analogous to the one that happened just earlier, and I do think short is good.

JPN225 Long after channel and support test. After breaking the down channel, I am waiting for a channel test on the same old support area, to go LONG and using an 160% fibo Projection as target.

JPN225 ShortThe JPN225 has reacted to the overlying supply zone.
A short trade on chart is suggested targeting the underlying demand zone.
From a Wyckoff perspective, price has recently posted the UTAD and heading down.

Joe Gun2Head Trade - NIKKEI at resistanceTrade Idea: Selling NIKKEI
Reasoning: Rallied into resistance
Entry Level: 28268
Take Profit Level: 27774
Stop Loss: 28368
Risk/Reward: 4.96:1
Disclaimer – Signal Centre. Please be reminded – you alone are responsible for your trading – both gains and losses. There is a very high degree of risk involved in trading. The technical analysis , like all indicators, strategies, columns, articles and other features accessible on/though this site is for informational purposes only and should not be construed as investment advice by you. Your use of the technical analysis , as would also your use of all mentioned indicators, strategies, columns, articles and all other features, is entirely at your own risk and it is your sole responsibility to evaluate the accuracy, completeness and usefulness (including suitability) of the information. You should assess the risk of any trade with your financial adviser and make your own independent decision(s) regarding any tradable products which may be the subject matter of the technical analysis or any of the said indicators, strategies, columns, articles and all other features.

Nikkei 225 Breakout - where to next? Weaker than expected growth in Japan led to markets expecting policy by the BOJ to be kept loose. This recent breakout now puts the index in positive territory YTD and it is now at a 7-month high. The question remains whether this is a breakout to be faded or has legs to move higher? The RSI seems to be rolling over from overbought territory. This could potentially setup a retest of the 28.364k former resistance level. The 50-day SMA also looks to be eyeing a golden cross with the 200-day SMA. The pattern that has emerged a flat sided ascending triangle is typically bullish.

Nikkei225This chart of the Nikkei225 stock average shows that this market topped in 1989 and a parallel channel of a down trend that has recently encountered resistance. The question is whether the price can break above this level and resume the recent bull market or whether the continuation of this extremely long term down trend will happen.
NI255 1HTrend analysis:
4H - Up trend
1H - Range
Pattern analysis:
- After again one cycle, bearish pattern

NIKKEI 225 CFD BEARISH PATTERNJapan Economy Watchers Current Index was announced yesterday, below its forecast and also below its neutral line of 50, at 43.8, which can be used as a marker for downturn of the country's economy.
On a technical level Japan 225 CFD broke the support of the rising wedge pattern, also signaling a potential bearish move on the instrument. Both MACD and RSI indicators confirm the pattern, and in both the fast moving average is increasing the gap with the slow moving average, indicated best by the MACD histogram. This might be read as an indicator for big movement.
If the pattern gets confirmed the price might test its previous low at 27840. If the opposite scenario occurs, the instrument might test the previous support of the rising wedge at 28270.
Risk Disclosure: Trading Foreign Exchange (Forex) and Contracts of Difference (CFD's) carries a high level of risk. By registering and signing up, any client affirms their understanding of their own personal accountability for all transactions performed within their account and recognizes the risks associated with trading on such markets and on such sites. Furthermore, one understands that the company carries zero influence over transactions, markets, and trading signals, therefore, cannot be held liable nor guarantee any profits or losses.

NIKKEI 225 BUYCONFIRMATIONS
- I believe price is going to fall for the next 12-14 hours however reverse of the ascending redline located on my fib at 27962.
- I never want to say this is a "prime example" because things can change. But this is a pretty regular chat pattern that is forming a "rising wedge". This is a chart pattern I look for very often.
- Price has continued to respect my ascending trend line.
- Price is simply in an uptrend.
- 50 MA is right under price.
- Risk/Reward is 3:1
- Waiting for a shooting star or inverted hammer candlestick.

