Percentage of stocks above 20MAIt's getting near that time again folks! 82% of AMEX:SPY stocks above 20MA which suggests a sharp pullback is imminent.

Market View going into 5/12/25Here's a short video looking at where the S&P 500 stands in terms of it's 200, 50, 20, and 5 day moving averages. I am still looking for a pull back to start swing trading long. Currently as of Friday I have small positions using inverse leveraged ETF's on SPY, QQQ, and Bitcoin. Cheers!

S&P 500 | Short-Term Breadth Signal | (April 2025)S&P 500 | Short-Term Breadth Signal | (April 27, 2025)
1️⃣ Insight Summary:
The S&P 500 percentage of stocks above the 20-day moving average is dropping sharply. This indicator is a great tool to catch local extremes — and right now, it’s flashing an important signal.
2️⃣ Market Setup:
🔻 Sell / O

Smart investor strategyS&P 500: Percentage of Stocks Above the 20-Day Moving Average
This indicator shows the percentage of S&P 500 stocks trading above their 20-day moving average. It visually reflects short-term market strength or weakness and helps identify potential reversal points.
🔻 Sell / Open Shorts Zones:
Lev

Market Reversal? S5TW Buy/Sell Zones + Samuel Benner Cycle!🚀 Market Timing with S5TW & Benner Cycle
🚀 Are We Near a Market Turning Point?
This chart combines S5TW buy/sell zones with the legendary Samuel Benner market cycle—a historical pattern used to forecast major bull and bear trends. If history repeats, we might be at a critical decision point!
🔹

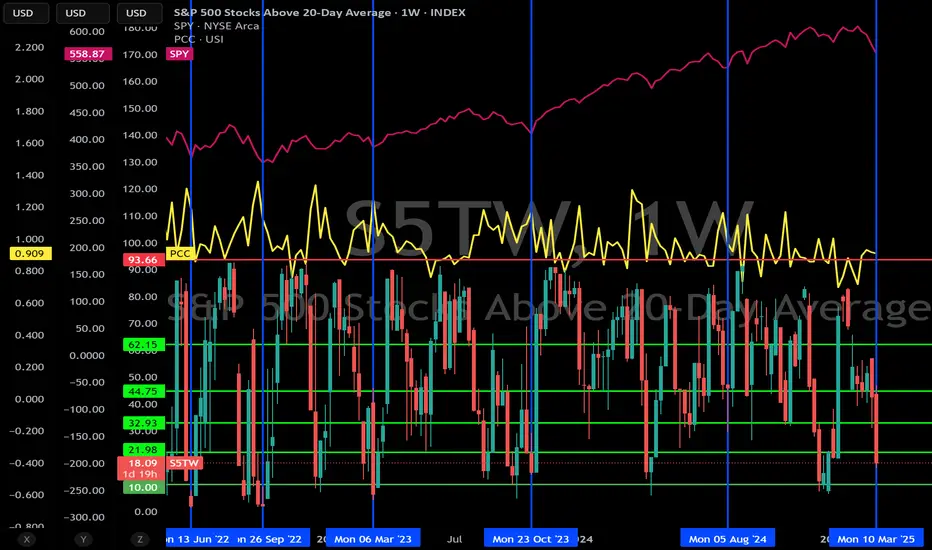
SPY, PCC & Percentage of S&P 500 Stocks Trading Above 20 SMASPY is in pink, PCC is in yellow and candles show S5TW (Percentage of S&P 500 stocks trading above their 20 SMA) on this weekly chart. You will notice after a significant drop of over 5% on S&P 500, once S5TW start getting below 20%, a reversal isn't that far away. Relief rally rips can be dramatic,
Overbought zoneWhen the SPX500 daily chart shows divergence, and the market breadth index is in an overbought or oversold condition, these are key trading opportunities.
Currently, we see that the market breadth index has entered the overbought zone.
Once the SPX500 daily RSI shows a divergence signal, it will be

Ketchup Market elken(B)readthHey Traders,
Got a little behind in posting some weekly look-backs and wanted to catch-up to this current week. I consolidated the "Weekly RSI Divergence" and the "elken(B)readth" charts into one.
We will be looking back at the week closes using my "blocker" rectangle; the obvious black-out on t

Semi-monthly PublicationLittle update before friday close. I may try and do this weekly but I do not want to flood my charts with a single segment. More to follow, slowly but surely!


See all ideas
Displays a symbol's price movements over previous years to identify recurring trends.