S5TW trade ideas


Eh... the lowest is 0%This is monthly chart showing % of stock above 20sma.
The lowest was 0.2% which happen in 2009 & 2011.
Based on the blue circled region, still a bit of space to be filled
Perhaps this time < 0.2%

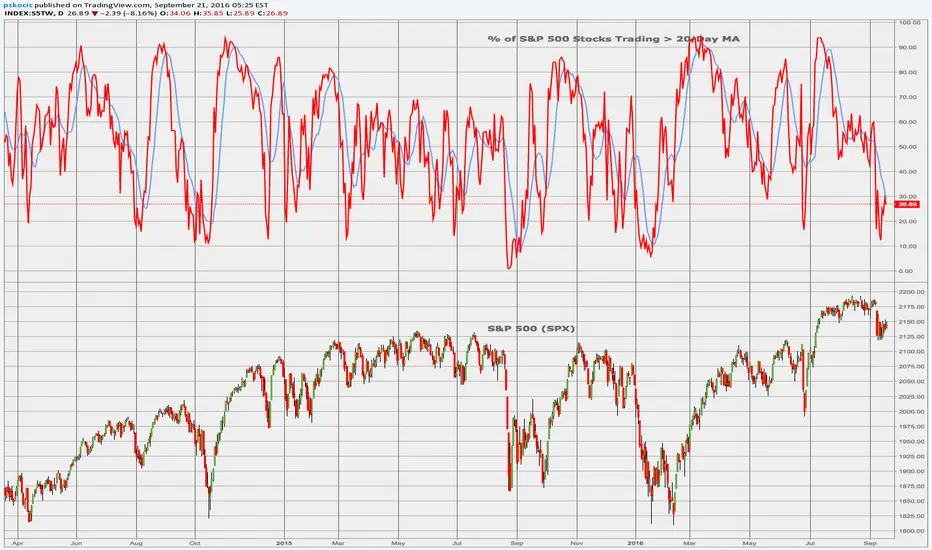
Market Breath and FASWe can see that stocks above 20 days MA is a good indicator to where market is overslod and ready to return to the main trend. We can use a highly correlated + highly volatile ETF to profit from this. It looks like the market is returning from extreme levels in the breath indicator and we have a clear stop.
