STI trade ideas
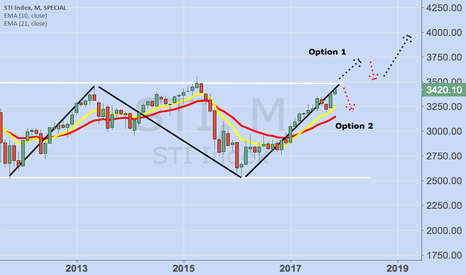
STI Index 2 Options as we come to the crossroads soon.
Option 1 : Breakout and pullback and head northwards to 4000+ price level
Option 2 : Breakdown as per previous 2 attempts
Analysts are expecting a breakout of 3500 , read news here
www.todayonline.com
I do not trade this index but use it as a barometer for overall stock performance and dive down into individual companies. Singapore is an important global financial hub and its stock performance is a good guide to the overall economy globally as well. US has always been an influence to its performance so watching US market will provide deeper insights into the various emerging markets performance.
Expect pullback in Jan 2018STI has reached the critical price zone of 3465 , hitting the right shoulder pattern. With the crossover of MACD soon, I expect the market to turn soft a little next month with some pull back in price action before we see another surge later. Buy on weakness.
www.businesstimes.com.sg
STI - A retracement or a reversal?The first half of 2017 has been a good run for the Singapore stock market - Straits Times Index (STI), gaining over 300 points.
However, we believe that a retracement or a reversal to the downside is imminent. The question is are we gonna see a retracement or a reversal?
Retracement
Price moves correctively, usually taking a longer period of time, and does not move much in terms of price.
Reversal
Price moves impulsively, usually taking a shorter period of time, and moves strongly in terms of price.
Knowing what constitute a retracement and a reversal is essential in knowing how to plan your trades.
1) If we see a correctively move lower towards 3077 area, it will present us a good opportunity to look for one more move to the upside towards 3360 area.
2) If we see an impulsively move lower breaking the trend line, we can expect price to move lower potentially towards 2901 area. If this happens, it will present us a good selling opportunity targeting 2901.
Based on our Elliott Wave analysis, with the current price development, we are expecting the 1st scenario to have a higher probability of happening.
Even if you are not trading the stock index, understanding and monitoring the equities market can provide us with the current market risk environment, and thus provide us with trading opportunities in the currency market too.
Straits Times Index (STI) - tracking the Singapore Stock IndexI was conducting a talk at a local Stock Broking house. Really appreciate the invitation to speak to a group of enthusiastic participants. The participants and I were looking at the STI, stock indices for Singapore.
There is a bearish Bat pattern completing much higher at around 3430. However there is an AB=CD pattern completing now at 3145/50. This is also at a support level back in Oct 2014. This gives me a slight bearish bias at this moment before it can continue higher.
Straits Times Index Daily (04.Oct.2014) Technical AnalysisThe Singapore Straits Times Index (STI) Daily Diagram Technical Analysis Training shows the following:
The STI index has reacted towards to EMA 200 last Friday. The index is under the KUMO, the Kijun Sen & Tenkan Sen too.
So the first think in mind seeing the diagram the 3287 approach. MACD and RSI tries for bullishness but are still bearish.
There is a bullish engulfing. The index is exactly on the EMA 200 resistance.
There is no special pattern. The fib technically shows the levels.
Long for 3287. Stop loss under the 3235.
Straits Times Index Daily (13.Sep.2014) Technical AnalysisThe Singapore Straits Times Index (STI) Daily Diagram Technical Analysis Training shows the following:
The STI index has breached the resistance line. The index is above the KUMO, Kijun Sen & Tenkan Sen..
So the first think in mind seeing the diagram the 3434 approach. MACD and RSI tries for bullishness.
There is no special candlestick pattern. The index is above EMA 200 and adove the KUMO.
There is no special pattern. The fib technically shows the levels and as it seems STI respect them.
Long for 3434. Stop loss under the KUMO.
Straits Times Index Daily (30.08.2014) Technical AnalysisThe Singapore Straits Times Index (STI) Daily Diagram Technical Analysis Training shows the following:
The STI index has made a second Local Top at 3355 last week after the first local top at 3394 on 2.618 of fib line. The index is under the long term support line that now is a resistance.
So the first think in mind seeing the diagram is if the behavior of STI now that is between the Kijun Sen (blue line) and the Tenkan Sen (Green line). MACD and RSI force their bearishness.
We have a bearish engulfing candlestick pattern last Thursday. . The index is above EMA 200 and adove the KUMO.
There is no special pattern. The fib technically shows the levels and as it seems STI respect them.
Maybe the index make some consolidations above the KUMO so I prefer to stay aside.
If the Index breaches the Tenkan Sen then long otherwise it will continues its correction movement towards to KUMO.
P.S. STI has made a long term reversal pattern breaching the 3250. The target is the 100% projection of long term low, that is 3250+(3250-2952) = 3548 for the next two-three months.
Straits Times Index Daily (17.08.2014) Tribute to EMAThis week we will see the EMA (50,100,200) and MACD,RSI for various diagrams.
The Singapore Straits Times Index (STI) Daily Diagram Technical Analysis Training shows the following:
The STI index has made a correction decline last two weeks and it reacted exactly on EMA 50 last Friday. There are several golden crosses on yellow circle in April that give a sense of bull market. The EMA 50 crossed EMA 100 & EMA 200 and EMA 100 crossed EMA 200 too.
MACD completed the negative divergence and now has an uptrend return above the zero line. RSI > 50.
The fib has a 2.618 level of resistance. Long for it. Stop loss under the EMA 50.
Straits Times Index Daily (10.08.2014) Technical AnalysisThe Singapore Straits Times Index (STI) Daily Diagram Technical Analysis Training shows the following:
The STI index has made a long development from January 2014 above the KUMO cloud. Now the Index is above the KUMO but below the Tenkan Sen (light green) and Kijun Sen(blue line) too. The weekly diagram is marginally bullish and monthly diagram is bullish too.
So the first think in mind seeing the diagram is if STI finds support at KUMO and turn the trend upside now that the support line has broken. MACD and RSI force their bearishness and the divergence has been created as we mentioned last week.
We have no special candlestick pattern. The index is above EMA 200.
There is no special pattern. The fib from 2952 to 3136 (projection) shows now a support at 1.618 of fib (3250) and a long term target at 2.618 of fib at 3434.
Maybe the index make some consolidations above the KUMO so I prefer to stay aside.
P.S. STI has made a long term reversal pattern breaching the 3250. The target is the 100% projection of long term low, that is 3250+(3250-2952) = 3548 for the next two-tree months.


