EURO STOXX 50 forecast timing analysis by Supply-Demand strength21-Jun
Stock investing strategies TVC:SX5E
Investing position about Supply-Demand(S&D) strength: In Rising section of high profit & low risk
Supply-Demand(S&D) strength Trend Analysis: About to begin an adjustment trend as a upward trend gradually gives way to a slowdown in rises and falling fluctuations
Today's S&D strength Flow: Supply-Demand(S&D) strength flow appropriate to the current trend.
View a Forecast Candlestick Chart Analysis of 10 days in the future: www.pretiming.com
(You can easily create a trading plan.)
D+1 Candlestick Color forecast: RED Candlestick
%D+1 Range forecast: 0.1% (HIGH) ~ -0.7% (LOW), -0.2% (CLOSE)
%AVG in case of rising: 0.8% (HIGH) ~ -0.2% (LOW), 0.6% (CLOSE)
%AVG in case of falling: 0.3% (HIGH) ~ -0.8% (LOW), -0.4% (CLOSE)
Price Forecast Timing Criteria: Price forecast timing is analyzed based on pretiming algorithm of Supply-Demand(S&D) strength.
SX5E trade ideas

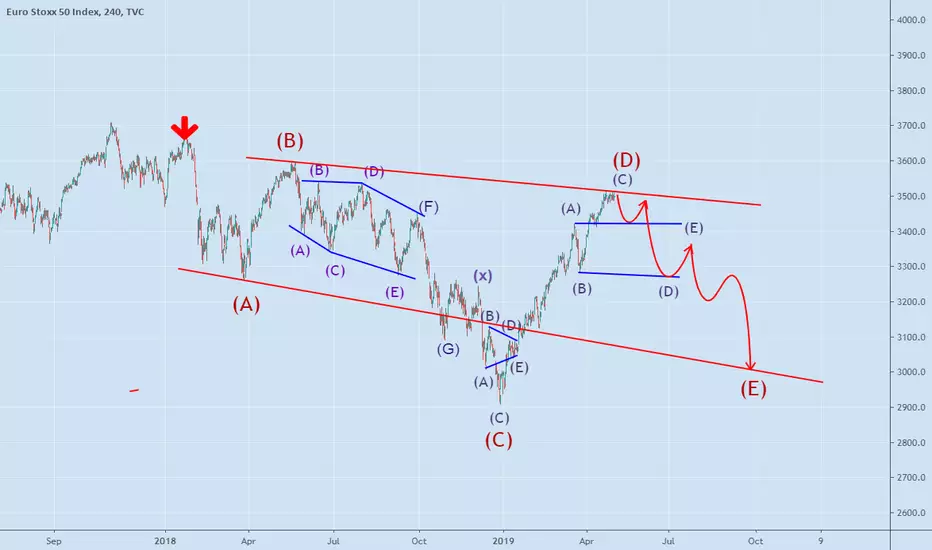
euro stoxx 50 - short 15/06/19Analysis looking back at the last 9 months movement of SX5E.
I am thinking this will now take a dip and stat to call over the next 4-7 market trading days.
Still relatively new to this market, feel free to take this all with a pinch of salt.
Let me know your thoughts...
Let me know if you agree...
Let me know how you get on =]


DAX & EU50 indexes I will open buy near mirror levels because
- Price broke up mirror levels and Downward trend
- Potential profit in 5 times bigger than a risk

SX5E, SHS pattern forming on D1: SellSX5E, SHS pattern forming on D1: Sell
- SHS pattern forming
- Breakout neckline
=> Sell

STOXX50 - H&SH&S pattern forming on the daily of STOXX50.
Target ~3120. Stop at top of right shoulder at ~3445.
Dashed lines: support / resistant zones.


Flag at EUROSTOXX 50 ?Flag at eurostoxx 50? maybe good money in it., im short in usoil as well, it can drive the markets down a bit more.

"Top and Bottom Analysis" EUROSTOXX (EU50EUR) by ThinkingAntsOk4H CHART EXPLANATION:
Main Items we observe on the Chart:
- Price broke the Ascending Channel and, then, bounced on the Resistance Zone.
- If price breaks the Ascending Trendline at 3381, it has potential to move down towards the Support Zone at 3300.
We are looking for Sell Setups on lower timeframes.
MULTI TIMEFRAME VISION:
- Weekly
- Daily


SHORT EUSTX50 @ 3475 Global markets are turning to bearish due to Trump's tariff twitter. For short, I believe Eurostoxx 50 is a nice object today. A strong bearish bar has broken the structure. Just wait for a step-back opportunity and sell it.
Entry: 3475
Stop: 3516
TP1: 3434 (We can trail it for more profit.)


"Top and Bottom Analysis" EUROSTOXX 50 by ThinkingAnts4H CHART EXPLANATION
- Price is currently on an Ascending Channel and, after bouncing on the bottom of it, theres potential to move towards the top.
- Price is above the previous resistance, trying to mark new max. It is currently in a Bullish Corrective Structure to continue the up move.
- If price breaks 3457, the target prices are determined by Fibonacci Levels (3502 and 3556,8).
Updates coming soon!
MULTI TIMEFRAME VISION:
- Weekly
- Daily


Eurostoxx 50 coming up to supplyJust looking to short as currently there is divergence on indicators and we are retesting an old supply level,
This has already been tested but immediately rejected, but am aiming for this to get back to the 50 ema for a nice R:R short trade


I'll #BUY #European #Indices Monday
For half a #week
#Breakeven &/or
#LongTerm #LONG
(to be continued: )
#StopManagement and #Exit after Monday's Entry
#European #Indices


Eurostoxx 50 Daily Wave 5 Cluster Level - Looking to shortLooking to short Eurostoxx based on the higher time frame fibonacci cluster level and the projected wave 5 of 5 completion with RSI overbought at 75 (not RSI's mean much on it's own)
Looking to short around 3400 targeting multiple targets from 3375 down to 3158,
See how we go...

Eurostoxx 50 Weekly Fib Cluster LevelThere is a fibonacci retracement cluster on the weekly chart of the Eurostoxx 50
This ranges from a long term 61.8% up to a 88.6% retracement using the various peaks and the same low point formed last December 2018
There is also a clear 5 wave advance from the lows which has formed a wave 5 of 5 , which also has a fibonacci extension cluster on the daily chart with Overbought RSI indicators
I'm planning to enter orders to sell around 3400 looking for a retracement to at least 3325 with the view it could eventually retrace back to wave 4 of the higher degree which would be around 3150 area
Potentially high reward to risk short trade with a combination of timeframes and indicators suggesting a short term top may be near
I will be entering a pending short order given the time frame and shear number of fibonacci cluster levels

