EuroStoxx 50: Critical Support to WatchThe EuroStoxx 50, one of Europe's most important benchmark indices, has been showing signs of weakness in recent days, making it crucial to keep an eye on certain support levels. According to Joan Cabrero, technical analyst at Ecotrader, investors should be vigilant about the index's performance around 4,800 points, a key support level. Should the index lose this zone, the next critical level is at 4,688 points, which corresponds to the lows of recent months.
The EuroStoxx 50 has struggled to overcome the bearish guideline that has guided its consolidation over the past nine months, with significant resistance at 5,050 points. This short-term failure in its attempt to overcome that guideline reinforces the need to keep an eye on the December and November lows, which will be critical in determining the short-term trend.
Strategy for Investors
For investors following Ecotrader's strategy, the recommendation is clear: do not reduce exposure to the European stock market as long as the EuroStoxx 50 does not lose the aforementioned support levels. The strategy is to wait for the index to approach these lows before considering new purchases.
In summary, the levels to watch on the EuroStoxx 50 are:
- Key support around 4,800 points.
- Critical support around 4,688 points.
- Resistance at 5,035 points.
The RSI is currently at 53.55%, the Check Point (POC) around 4,972 points.
Investors should keep an eye on these levels to make informed decisions and adjust their portfolios according to the evolution of the index.
Ion Jauregui - Analyst ActivTrades
*******************************************************************************************
The information provided does not constitute investment research. The material has not been prepared in accordance with the legal requirements designed to promote the independence of investment research and such should be considered a marketing communication.
All information has been prepared by ActivTrades ("AT"). The information does not contain a record of AT's prices, or an offer of or solicitation for a transaction in any financial instrument. No representation or warranty is given as to the accuracy or completeness of this information.
Any material provided does not have regard to the specific investment objective and financial situation of any person who may receive it. Past performance is not reliable indicator of future performance. AT provides an execution-only service. Consequently, any person acing on the information provided does so at their own risk.
SX5E trade ideas

STOXX50 "EURO STOCK 50" Indices Market Bullish Heist Plan🌟Hi! Hola! Ola! Bonjour! Hallo!🌟
Dear Money Makers & Robbers, 🤑 💰
Based on 🔥Thief Trading style technical and fundamental analysis🔥, here is our master plan to heist the STOXX50 "EURO STOCK 50" Indices market. Please adhere to the strategy I've outlined in the chart, which emphasizes long entry. Our aim is the high-risk Red Zone. Risky level, overbought market, consolidation, trend reversal, trap at the level where traders and bearish robbers are stronger. Be wealthy and safe trade.💪🏆🎉
Entry 📈 : You can enter a Bull trade after the breakout of MA level 5000.00
however I advise placing Buy limit orders within a 15 or 30 minute timeframe. Entry from the most recent or closest low or high level should be in retest.
Stop Loss 🛑: Using the 30min period, the recent / nearest low or high level.
Goal 🎯: 5130.00 (or) escape Before the Target
Scalpers, take note 👀 : only scalp on the Long side. If you have a lot of money, you can go straight away; if not, you can join swing traders and carry out the robbery plan. Use trailing SL to safeguard your money 💰.
Warning⚠️ : Our heist strategy is incompatible with Fundamental Analysis news 📰 🗞️. We'll wreck our plan by smashing the Stop Loss 🚫🚏. Avoid entering the market right after the news release.
Fundamental Outlook 📰🗞️
Considering these factors, the STOXX50 / EURO STOCK 50 index may experience a Bullish trend in the short-term, driven by:
Strong European economic growth, driven by strong consumer spending and investment.
Low interest rates and negative real interest rates, which can increase demand for stocks and reduce demand for bonds.
Potential for a rebound in corporate earnings, driven by strong profit margins and cost-cutting measures.
Bullish Factors:
Strong European economic growth, driven by strong consumer spending and investment.
Low interest rates and negative real interest rates, which can increase demand for stocks and reduce demand for bonds.
Potential for a rebound in corporate earnings, driven by strong profit margins and cost-cutting measures.
Growing investment demand for European stocks, driven by their potential for long-term growth and dividend yields.
Diversification benefits of investing in the European market, which can reduce portfolio risk and increase returns.
Some of the key stocks that make up the STOXX50 / EURO STOCK 50 index include:
SAP SE: A leading software company
Sanofi SA: A leading pharmaceutical company
Total SA: A leading energy company
Bayer AG: A leading pharmaceutical company
Deutsche Telekom AG: A leading telecommunications company
These stocks can have a significant impact on the performance of the STOXX50 / EURO STOCK 50 index, and investors should keep a close eye on their earnings and valuations when making investment decisions.
Market Sentiment:
Bullish sentiment: 70%
Bearish sentiment: 30%
Neutral sentiment: 0%
Please note that this is a general analysis and not personalized investment advice. It's essential to consider your own risk tolerance and market analysis before making any investment decisions.
Take advantage of the target and get away 🎯 Swing Traders Please reserve the half amount of money and watch for the next dynamic level or order block breakout. Once it is resolved, we can go on to the next new target in our heist plan.
Keep in mind that these factors can change rapidly, and it's essential to stay up-to-date with market developments and adjust your analysis accordingly.
💖Supporting our robbery plan will enable us to effortlessly make and steal money 💰💵 Tell your friends, Colleagues and family to follow, like, and share. Boost the strength of our robbery team. Every day in this market make money with ease by using the Thief Trading Style.🏆💪🤝❤️🎉🚀
I'll see you soon with another heist plan, so stay tuned 🫂


Eurostoxx 50 Index Rises Above 5000Eurostoxx 50 Index Rises Above 5000
As indicated by the chart of the Eurostoxx 50 index (Europe 50 on FXOpen), its value climbed above the psychological level of 5000 points in early 2025.
The strength of demand may be driven by portfolio rebalancing or long-term investor expectations, as today’s news for the European stock market was negative. According to ForexFactory:
→ industrial orders in Germany dropped by 5.1% month-on-month (expected: -0.3%);
→ retail sales in Germany fell by 0.6% month-on-month (expected: +0.5%);
→ France reported a worsening government budget balance.
A technical analysis of the Eurostoxx 50 index (Europe 50 on FXOpen) chart shows that:
→ the current value is above a resistance line (shown in red), which dates back to spring 2024;
→ since then, bulls have made two attempts to break above this line (marked with arrows) but failed to sustain the gains.
It is possible that further negative economic news from Europe could trigger bearish activity—if so, we may witness a third unsuccessful attempt to hold above the red resistance line, potentially resulting in the formation of a false breakout pattern.
This article represents the opinion of the Companies operating under the FXOpen brand only. It is not to be construed as an offer, solicitation, or recommendation with respect to products and services provided by the Companies operating under the FXOpen brand, nor is it to be considered financial advice.

The Shifting Global Investment Landscape in 2025The global investment landscape is experiencing a significant shift as Europe, China, and Latin America navigate unique challenges while regions like India continue to attract substantial inflows. European funds, in particular, are facing headwinds , losing $56 billion in outflows during 2024. This is due to economic stagnation, industrial struggles in key markets like Germany, and challenges in the green energy sector. The European Union's measures, including tariffs on Chinese imports, are seen as short-term solutions, failing to resolve underlying structural issues. Additionally, lower returns compared to the U.S. and uncertainty surrounding geopolitical and economic policies have made the region less appealing to global investors.
In contrast, China has seen impressive inflows of $130 billion in 2024. However, this recovery is driven by a low base effect following years of economic disruption, including the real estate crisis and pandemic lockdowns. While sectors like electric vehicles and technology remain attractive, investors are cautious about China's political and economic uncertainties. Latin America, too, struggles with declining investments, especially in Brazil, where political instability and fears of populist policies have dampened investor confidence.
India, on the other hand, has emerged as a standout performer. Record-breaking inflows in 2024 highlight its growing appeal, driven by structural reforms that simplify market access and an expanding middle class that underpins strong domestic growth. India offers investors a "pure" business proposition, relatively free from the geopolitical risks that burden other regions like China and Brazil.
Looking to 2025, the U.S., India, and the Middle East are positioned to lead global investment flows. The U.S. remains resilient, particularly in mid-cap equities, while India’s growth narrative continues to attract capital. The UAE and other Middle Eastern markets are also gaining attention as emerging hubs for infrastructure and technology investments. Success in 2025 will depend on navigating geopolitical risks and targeting regions with sustainable growth potential.
NSE:NIFTY
SSE:000001
SP:SPX

Europe got nothing, and will get TrumpedEurope has no invention, no dominating industry or companies, the German locomotive is out of order. Who or what will step up? No one and nothing. Key Trump. Europe is old and slow, will take ages for it to adapt. Short.

European Funds Losses: Key Global Investment Trends for 2025The global investment landscape is shifting significantly, with European funds experiencing large-scale outflows compared to other regions, such as the U.S. and Asia. Amid mounting economic challenges, geopolitical uncertainties, and the evolving preferences of institutional investors, the question arises: why are investors looking elsewhere, and what opportunities upcoming ahead?
Europe's Economic and Investment Challenges
The outflows from European funds are primarily driven by structural and macroeconomic issues. Key factors include:
1. Industrial Decline : Core economies like Germany face factory closures and rising unemployment, eroding investor confidence.
2. Energy Competition : Europe's green energy sector is under pressure from cheaper Chinese alternatives. EU responses, such as tariffs, are seen as stop-gap measures rather than long-term solutions.
3. Broader Instabilities : Geopolitical issues, migration concerns, and ongoing conflicts exacerbate uncertainty, leaving Europe less competitive compared to U.S. markets.
Even with lower yields and declining rates, Europe has struggled to match the appeal of U.S. treasuries, offering 5%+ returns, and equities in more stable regions.
China: A Recovery with Risks
China has seen significant inflows in 2024, attributed to economic recovery after years of challenges, including real estate crises and the pandemic's fallout. While sectors like EVs and tech attract global attention, investors remain cautious due to the nation's political and economic volatility. Notably, the rise in Chinese inflows partly stems from a low base effect following prolonged underperformance.
Latin America: Declining Investor Sentiment
Latin American markets, particularly Brazil, face persistent challenges. In October 2024 alone, Brazil recorded a $2.5 billion equity outflow, as fears over populist policies and political instability rise. According to majority, the region's risks now outweigh its growth potential.
India: A Standout Performer
India stands out as a rising star in global investment, achieving record-breaking inflows in November 2024. Key reasons for its appeal include:
1. Market Accessibility : Reforms have simplified access for institutional investors, elevating India from an "exotic" to a mainstream market.
2. Structural Growth : With a rapidly expanding middle class and robust domestic consumption, India offers strong internal growth stories, independent of geopolitical narratives.
3. Stability and Predictability : Compared to China and Latin America, India's business environment is perceived as more transparent and less risky.
2025 Investment Outlook
Looking ahead, investors should consider these key regions and trends:
• The U.S. : Continued strength, particularly in mid-cap equities.
• India : Sustained inflows as reforms and economic growth attract capital.
• The Middle East : The UAE is emerging as a hub for infrastructure and tech investments.
Meanwhile, Europe, China, and Latin America face considerable challenges. Navigating 2025 will require a focus on growth markets and a deep understanding of geopolitical risks.
NSE:NIFTY
SSE:000001
LSE:XMLA

Global investment trends: Europe loses capital, China and IndiaReasons for record outflows from European funds (-56 billion dollars)
The main reason for European fund outflows is the slowdown in economic growth of the region. After the energy crisis of 2022-2023, EU economies have never been able to return on a path of sustainable growth. High interest rates, which the European Central Bank continued to keep in place to fight inflation, have had a negative impact on business activity and investment attractiveness.
In the face of such challenges, yields in Europe have become lower than in the US. Moreover, European companies, despite the isolated successful cases, do not have a clear advantage. For example, if we take Germany, which has always been considered to be the flagship of Europe, we can see, that it is clearly losing momentum: plant closures , mass layoffs , and industrial problems are all systematic indicators. Europe currently is a region with a set of isolated appealing ideas, not a place where it is worth investing broadly.
The aforementioned green energy sector, for example, in theory could be Europe's strength, but in practice China offers similar technologies for cheaper, and imposing protective duties is not a long-term solution. Moreover, the energy dependence on Russian gas and current support for Ukraine seem to be policies without a concrete plan for the future. It's precisely why the money is going to the States: everything is predictable there, yields are higher, and the dollar is stronger.
Factors influencing investor behavior
In regards to China in 2024, it started to come back to life after a rather difficult period. China was an ideal investment destination for a long time, thanks to double-digit growth rates. But after the pandemic and a series of crises - such as the mortgage crisis - the pace has slowed and confidence in the market has been shaken. Meanwhile, China's auto industry and a number of other sectors continue to grow . The $130 bln invested in Chinese funds is more the effect of a low base and pent-up demand than a real breakthrough. Yes, China remains an important player, but now with a few caveats: it is no longer the magnet for investment that it used to be.
Reasons for increased demand for Chinese funds (record $130bln in funds this year)
India, on the other hand, looks extremely promising . Since the beginning of 2024, $20 bln has been invested there, which is a record amount. This is due to both structural reforms and the fact that India is perceived as the new China: a fast-growing economy with a huge population. In contrast to China, there is less geopolitical risk, and when investors invest in an Indian company, they are really buying a business, not a political or ideological story.
Comparison of India (+$20bln, the best record of all time) and Brazil (withdrawals -$3.3bln Funds)
It's different with Brazil. 2024 was a year of political turbulence for this country. Municipal elections and fear of populism have caused investors to withdraw money from the country. No one wants Brazil to become a second Argentina. Geopolitical risks are the main reason for capital outflows from Brazil and Mexico.
Forecasts for fund demand next year
Looking ahead to 2025, the US mid-cap, the broad market in India and new opportunities in the Middle East, such as the Emirates , are worth paying attention to. The US will continue to attract investment, especially with its strong dollar and clear politics, and Europe, as it seems, is finally losing its charm.
NSE:NIFTY
TADAWUL:TASI

EUROSTOXX broke the DownTrend Line.The EURO STOXX 50, which serves as a benchmark for major eurozone companies, has been trading sideways in recent months, fluctuating between a strong support level at 4,730 and resistance at 5,099. After multiple tests of the support, the price has formed candles with long lower shadows, indicating a rejection of lower prices and buyer interest in maintaining levels above this critical point.
Recently, the index provided a significant technical signal by breaking the Downtrend Line that had been in place since previous peaks. This breakout is a strong indicator of potential short-term growth.
Main Scenario: Bullish
With the Downtrend line broken, the price now has the potential to target higher levels on the daily chart. The 5,000.00 area is the first key resistance to watch, followed by the previous peak at 5,099, which would confirm a stronger bullish trend.
Potential Bullish Movement:
Ideal Entry: A pullback to around 4,830.00 (near the broken downtrend line), followed by a bullish candle in that area, could signal a buying opportunity.
Primary Target: 5,015.00.
Secondary Target: 5,099.17.
Stop Loss: Below 4,740, with a more conservative option at 4,727.00 (indicating loss of support).
Important Indicators: Monitoring volume during the rally is crucial; low volume could indicate weakness in the breakout.
Alternative Bearish Scenario
Despite the bullish technical scenario, the market may reverse if the support region at 4,727.48 is broken. A consistent daily close below this level, accompanied by significant volume, would invalidate the bullish structure and could attract strong selling pressure.
In this case, a possible Sell Opportunity could appear if a daily candle closes below the 4,727.00 level. Possible targets would be:
4,500.00: Intermediate psychological and technical support. About 22700 points.
4,400.00: Next relevant support, observed in previous months. About 33700 points.
A Stop Loss could be put around 4,770.00, about 4300 points.
Warning Signs: Heightened global risk aversion, a declining macroeconomic situation in Europe, and ongoing weakness in industrial and consumer sectors could intensify selling pressure.
Macroeconomic Context
Europe faces a tough landscape. Germany, the region's primary economic driver, is grappling with an industrial slowdown and reduced consumption, impacting the competitiveness of its companies. These issues have lowered growth projections for the eurozone.
Additionally, escalating tensions with Russia present a significant geopolitical risk. As the European Central Bank seeks to balance inflation control with growth stimulation, uncertainty in both geopolitical and economic spheres continues to affect the markets.
The upcoming interest rate decision on December 12 may provide clearer guidance on the European Central Bank's future actions.
Disclaimer
74% of retail investor accounts lose money when trading CFDs with this provider. Consider whether you understand how CFDs work and if you can afford the high risk of losing your money. Past performance is not indicative of future results. Investment values may fluctuate, and you may not recover your initial investment. This content is not intended for residents of the UK.

EuroStoxx 50: Sideways StrategiesMarket Context
Recent trading sessions have been marked by expectations regarding the US Federal Reserve 's monetary policies. The market anticipates that the US central bank will adopt a less aggressive stance in its interest rate cuts. This backdrop has boosted the dollar, which has gained nearly 4% from last month's lows, as reflected in the Dollar Index, which measures the currency's performance against a basket of international currencies.
This more consolidated environment has impacted both the Ibex 35 and the EuroStoxx 50, with both indices coming dangerously close to their technical supports. For the Ibex 35, key support lies between 11,560 and 11,600 points, the break of which would indicate a bullish exhaustion.
EuroStoxx Analysis
The EuroStoxx 50 (Ticker AT:EURO50), one of Europe's benchmark indices, is less than 1% away from its first key support, located around 4,900 points, coinciding with the delta buying pressure zones and the checkpoint zone (POC) of the price bell. The proximity to this technical level has generated concern among investors, as a possible breakout could trigger a more prolonged consolidation phase in the European market. Given that the shift of the sideways range will be pronounced for a longer period. Currently the movement between the highs of 5,310.41 and the support marked in February and reinforced in August in the area of 4,669 points. If we follow the current movement, everything seems to indicate that the crossing of the 50-average over the 200-average that began in the last week of September is losing strength. And if we accompany it with the Bollinger bands support the idea that the market seems to be highly lateralized.
Outlook for the EuroStoxx 50
In the case of the EuroStoxx 50, a drop below 4,840 points could lead to a broader price retracement confirmation, and would take the index to the September lows at 4,700 points, which coincides with the lower zone of the sideways range. However, this drop is not necessarily perceived as a negative signal, but as a possible buying opportunity in the European market. As long as the index does not break the September lows, the bias will remain bullish, offering opportunities for investors looking for re-entries in the European market.
Ion Jauregui - Activtrades Analyst
*******************************************************************************************
The information provided does not constitute investment research. The material has not been prepared in accordance with the legal requirements designed to promote the independence of investment research and such should be considered a marketing communication.
All information has been prepared by ActivTrades ("AT"). The information does not contain a record of AT's prices, or an offer of or solicitation for a transaction in any financial instrument. No representation or warranty is given as to the accuracy or completeness of this information.
Any material provided does not have regard to the specific investment objective and financial situation of any person who may receive it. Past performance is not reliable indicator of future performance. AT provides an execution-only service. Consequently, any person acing on the information provided does so at their own risk.

New Bullish RynCAPITALCOM:EU50 has remained flat for most of the year. However, the US Exceptionalism may positively affect Europe despite major headwinds including a weaker European economy compared to the US. The China stimulus bazooka may lift the ticker as well.

KEEP BUYS FOR LONG TERM TARGET AT 6540 WITH EXTENSION TO 6779Price has been expanding on a growth sequence of the square root of 2
From a unit square price expands through a sequence of 1.000, 1.4142, 2.000, 2.828, 4.000...
2020 crash made a low at 2302.84, from this level we have a growth sequence following that of a unit square with variation of Phi
From the low at 2302.84 we've had three tops 3451.16, 4415.23 and 5121.71
(3451.16 - 2302.84) = 1148.32 points = (1.0)
(4415.23 - 2302.84) = 2112.39 points = (2.0)
(5121.71 - 2302.84) = 2818.87 points = (2.828)
Between the first two tops: (4416.23 - 3451.16) = 964.07 pts
The second and third tops: (5121.71 - 4415.23) = 706.48 pts
The two expansion tops combine to give us (964.07 + 706.48) = 1670.66 pts
From the low we then find a growth sequence of 1148.32 and 1670.66 points with the 1670.66 side subdividing into harmonics of 964 - 706
We can then conveniently project the next top to complete at the 4.0 expansion of the unit square and 4.236 Phi function. Since we have a range between 4.0 and 4.236 this will give us the zone 6540 to 6779 to expect the next major top. Adding a time function will greatly reduce the range for a clue when to expect this top. The time measurement on the chart shows a 609, 616, 378 days between major points, next time mark should align with price at the top.
Please check back or follow for updates
Trade safe and good luck

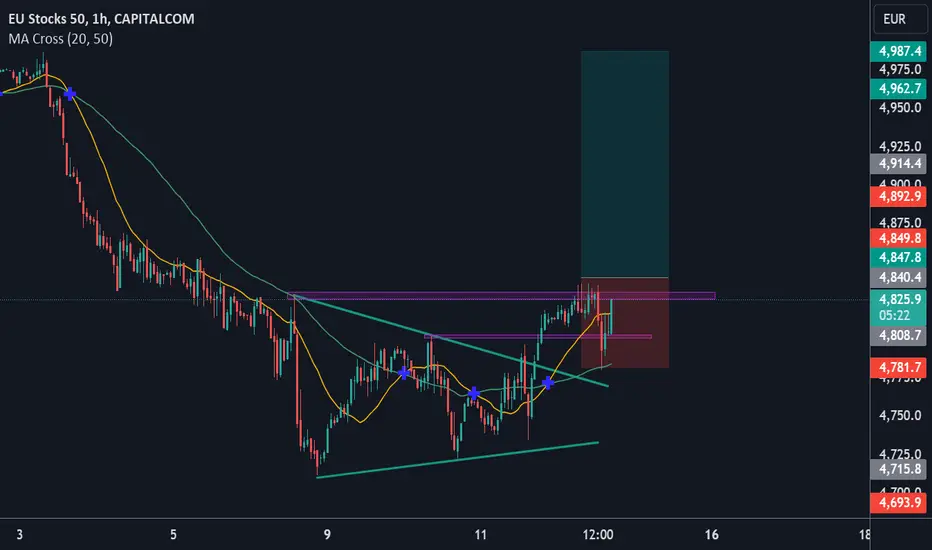
Long TradeThis a perfect trade to go long, we have a triangle pattern and a breakout showing that the price is reversing, and a confirmation inform of a pullback, now all we have to do is set a buy order at the high of the pattern and we go long
Euro 50 short ideaTechnical Analysis:
A series of lower highs since the peak in March, indicating weakening bullish momentum. The index has recently broken below a significant support level, suggesting further downside potential.
- The current price (4,747.5) is well below the recent high, showing a sharp decline.
- We also see a bearish white swan pattern.
- The wave trend is curving downwards.
- There is a Lorentzian Classification sell signal.
- The z score is negative.
Several fundamental factors support a bearish outlook:
1. Economic Slowdown: The Eurozone is facing economic headwinds, with Germany, its largest economy, experiencing a technical recession in early 2024. This could negatively impact corporate earnings across the region.
2. Monetary Policy: The European Central Bank (ECB) has maintained high interest rates to combat inflation. While this helps control inflation, it can also slow economic growth and make borrowing more expensive for companies.
3. Geopolitical Tensions: Ongoing conflicts and trade disputes globally can increase market volatility and decrease investor confidence in European equities.
4. Energy Concerns: Europe's energy situation remains precarious, with potential supply issues and high prices potentially impacting industrial output and consumer spending.
5. Strong Euro: A relatively strong euro against other major currencies could hurt the competitiveness of European exports, affecting the earnings of many companies in the index.
Estimated SL: 4890
Estimated TP: 4500
This is merely an idea and not a recommendation to take the trade. Your trade, your responsibility, your risk.

STOXX50/ EUROPE 50 Bullish robbery PlanMy Dear Robbers / Money Makers & Newbies,
This is our master plan to Heist STOXX50 / EUROPE 50 based on Thief Trading style Technical Analysis.. kindly please follow the plan I have mentioned in the chart focus on Long entry. Our target is Red Zone that is High risk Dangerous level, market is overbought / Consolidation / Trend Reversal at the level Bearish Robbers / Traders gain the strength. Be safe and be careful and Be rich.
Note: If you've got a lot of money you can get out right away otherwise you can join with a swing trade robbers and continue the heist plan, Use Trailing SL to protect our money.
Entry : Can be taken Anywhere, What I suggest you to Place Buy Limit Orders in 15mins Timeframe Recent / Nearest Swing Low
Stop Loss : Recent Swing Low using 2h timeframe
Warning : Fundamental Analysis comes against our robbery plan. our plan will be ruined smash the Stop Loss. Don't Enter the market at the news update.
Loot and escape on the target 🎯 Swing Traders Plz Book the partial sum of money and wait for next breakout of dynamic level / Order block, Once it is cleared we can continue our heist plan to next new target.
Support our Robbery plan we can easily make money & take money 💰💵 Follow, Like & Share with your friends and Lovers. Make our Robbery Team Very Strong Join Ur hands with US. Loot Everything in this market everyday make money easily with Thief Trading Style.

STOXX 50 / EURO 50 Bullish Robbery Plan To Steal MoneyHello My dear,
Robbers / Money Makers & Losers.
This is our master plan to Heist STOXX 50 / EURO 50 Market based on Thief Trading style Technical Analysis.. kindly please follow the plan I have mentioned in the chart focus on Long entry. Our target is Red Zone that is High risk Dangerous level, market is Trap / overbought / Consolidation / Trend Reversal at the level Bearish Robbers / Traders gain the strength. Be safe and be careful and Be rich.
Note: If you've got a lot of money you can get out right away otherwise you can join with a swing trade robbers and continue the heist plan, Use Trailing SL to protect our money.
Entry : Can be taken Anywhere, What I suggest you to Place Buy Limit Orders in 15mins Timeframe Recent / Nearest Swing Low
Stop Loss : Recent Swing Low using 2h timeframe
Warning : Fundamental Analysis comes against our robbery plan. our plan will be ruined smash the Stop Loss. Don't Enter the market at the news update.
Loot and escape on the target 🎯 Swing Traders Plz Book the partial sum of money and wait for next breakout of dynamic level / Order block, Once it is cleared we can continue our heist plan to next new target.

EU50 - In Bullish TrendEU50 in bullish trend on an hourly chart. No divergence, clean HHs and HLs. Placed a pending order of Buy Stop.
The Signal is:
EP: 4909.90
SL: 4827.50
TP: 4992.30
RR: 0.5%

EU50 to fall fast to 4382After months of bouncing up and down, the EU50 is under severe bearish pressure and it appears that the pressure will continue next week until we hit the Weekly support price area around 4382.
As price consolidated for such a long time, the force of the trend seems to be correlating.
Stop Loss and Take Profit suggestions are labelled on the chart.
What do you think?

EUROSTOXX50: The Bulls Are BackEuropean stocks, led by the EuroStoxx 50, could end the week in positive territory despite a volatile start marked by significant declines. The observed recovery has alleviated recession fears and stabilized the markets, although the EuroStoxx 50 remains in a consolidation phase that has lasted for four months. Recent drops in the index present a buying opportunity, especially if key support levels around 4,396 points are reached.
In the fixed income market, strong purchases are anticipated today, with U.S. bond yields returning to around 4% after dipping below 3.8%. Today, inflation and trade balance data from several Eurozone countries will be released. Notably, the German indicator may suggest an expected increase in inflation. A slight improvement is also anticipated in the production of some Eurozone countries.
Looking at the chart, the market appears to be trying to return to the main trading zone marked by the Point of Control (POC) around 4,984 points, roughly 300 points above the current trading area. If the support at 4,552 points holds, it could signal a recovery in the Eurozone, as represented by this index. The RSI currently shows no excessive strength but does indicate a move back towards the mean with 40.44%, suggesting buyers are returning since August 5th.
Ion Jauregui – ActivTrades Analyst
*******************************************************************************************
The information provided does not constitute investment research. The material has not been prepared in accordance with the legal requirements designed to promote the independence of investment research and such should be considered a marketing communication.
All information has been prepared by ActivTrades ("AT"). The information does not contain a record of AT's prices, or an offer of or solicitation for a transaction in any financial instrument. No representation or warranty is given as to the accuracy or completeness of this information.
Any material provided does not have regard to the specific investment objective and financial situation of any person who may receive it. Past performance is not reliable indicator of future performance. AT provides an execution-only service. Consequently, any person acing on the information provided does so at their own risk.

Europe begins recovering the Black MondayIn Asian markets, Japan's Nikkei is up 10% this morning after a historic drop, while Wall Street futures also show stability. San Francisco Fed President Mary Daly calms recession fears, boosting confidence in the direction of inflation. However, investors are cautious, waiting for more signals from central banks.
The European STOXX 600 index is up 0.4% this morning, recovering after hitting six-month lows with a -9.28% drop in just two trading days equivalent to 457.25 European index points. This rise is due to the global recovery and positive corporate earnings updates. Euro STOXX volatility decreases after reaching its highest level since March 2022.
Technology and banking stocks lead the gains, with Monte dei Paschi di Siena up 8.4% and Adecco up 5% despite hiring warnings. Zalando and Abrdn also report significant increases in earnings and operating profits.
We already saw on the 23rd an inverted hammer that precipitated on Friday and Monday with a highly unexpected index correction in Europe, but that could be glimpsed due to the exhaustion of the market in general, and the RSI marked the change of direction to sell. At the moment we have the RSI oversold at 28.87% so it would not be unusual in conjunction with the shape of the current figures, that the price recovers to the channel generated on volumes set around the bell. The current average trading zone is located around 4,972 points, so if the European market shows strength in trade balance and industrial production indexes such as the German one, which are key for the Euro zone, we will see a strengthened EuroStoxx 50 resurging from the current price zone and trying to recover the lost gains of the whole year in just two days. In absolute terms, the index has fallen almost -13% since March.
Ion Jauregui – ActivTrades Analyst
*******************************************************************************************
The information provided does not constitute investment research. The material has not been prepared in accordance with the legal requirements designed to promote the independence of investment research and such should be considered a marketing communication.
All information has been prepared by ActivTrades ("AT"). The information does not contain a record of AT's prices, or an offer of or solicitation for a transaction in any financial instrument. No representation or warranty is given as to the accuracy or completeness of this information.
Any material provided does not have regard to the specific investment objective and financial situation of any person who may receive it. Past performance is not reliable indicator of future performance. AT provides an execution-only service. Consequently, any person acing on the information provided does so at their own risk.

EUROSTOXX reversalEuroStoxx 50 reversing.
Reached the (A)-(B) 161.80% target, and turned around.
Topped the rising wedge lines that start on the 2019 highs and the 2020 lows.
Weekly RSI with negative momentum since may
Short term, PT 4500 area, prior 2021 and 2023 highs

EU50 CASH - In Bearish TrendEU50 Index is in bearish trend following dow theory. The analysis is done on a 1H time frame and no divergence is observed. SL is placed on a recent LH and entry point is at 0.5 level of Fib retracement.
The Signal is:
EP: 4794
SL: 4843
TP: 4745
RR: 1%
Lost: 1.99
