INJUSD Kraken pair Double Top, bearish signsInjective Protocol had a blast in the second half of the year 2023. It looks like BTC ETF hasn't such an impact and new money hasn't flowed into the market as expected.
INJ has a double top formed, and the daily candles trendline is being tested at the moment. If it breaks, a nice correction (which is healthy) for the price foreseen.
always happy to hear other opinions.
INJUSD trade ideas

INJ/USD Long position opening 4HInjective shows bullish trend towards Volan mainnet upgrade.
Fair Value Gap is taken from daily chart, where price should come back at least once before heading to TP1.
Bulls are supported by BTC ETF approval by SEC, therefore I don't see any bearish movement is short period.
Be aware of 'buy the rumour, sell the news' movement.
Always happy to receive feedback, therefore don't hesitate to comment.

INJ will compete with CEX's?Ever felt like the markets are manipulated? That there are hidden forces manoeuvring prices this way and that, like puppeteers pulling the strings? Regardless of whether this happens or not, the capacity for centralised exchanges or market makers to do so is most definitely real.
Enter decentralised exchanges and more pertinently, Injective Protocol. INJ is a fully permissionless, Binance-backed, finance-centric blockchain, that acts as a platform to trade derivatives, execute smart contracts and build dapps. All transactions and operations are carried out on-chain, reducing manipulation risk and the use of centralised order books.
INJ has already performed a massive 20X in the last 12 months, outperforming the large cap alt-market massively, especially when you consider it has already been through a bull run (admittedly without some major exchanges listing the token). I'm not in INJ, but will be looking for dips to get in on, with the levels above being areas of interest, gradually increasing my buy amount, if it dips more and more.

Wyckoff Distribution on INJ (1H)INJ is showing signs of a massive sell-off coming soon. Here is the explanation for this Wyckoff Distribution:
PS (Preliminary Support):
Initial support forming after a prolonged downward movement. Indicates substantial buying with increased volume and wider price spreads, signaling potential end of the downtrend.
SC (Selling Climax):
Point of maximum selling pressure and panic among the public, absorbed by larger professional interests near a market bottom. Often sees a price close above the low, reflecting buying by these larger interests.
AR (Automatic Rally):
Follows a decrease in intense selling pressure, marked by an easy wave of buying that pushes prices up, often fueled by short covering. The rally's high helps define the upper boundary of an accumulation Trading Range (TR).
ST (Secondary Test):
Revisits the SC area to test supply/demand balance. Confirmation of a bottom involves diminished volume and price spread. Multiple STs are common after a SC.
LPS (Last Point of Support):
Low point of a pullback after a SOS. Pullback to former resistance turned support, with diminished spread and volume. There might be more than one LPS on some charts.
Follow if you like this kind of analysis!

INJ long opening @ FVG. Bullish Volant movesBTC ETF is approved which is good sign for overall crypto market. Volant mainnet upgrade today for INJ makes bullies attack, although bears tried to fight quite hard.
Day canddle provides FVG where price will comeback for at least once before reaching TP1.
Also, be aware of 'buy the rumour, sell the news'.
Always happy to have receive a feedback, therefore don't hesitate to comment!

INJ - Can it go up forever?Looking at INJ, like many, I'm blown away at how this seems to have more in the tank - it just doesn't appear to be running out of puff!
Where could it go? In the 2 weeks from Christmas to early Jan, we saw it go from $43~ down to $33~
Could a correction of this type be in the cards again? I think it is only healthy. And if so, does this mean a potential retest of the low $30 range? If it does, I'm tipping we could see a quick dip to $28, but if it does it will quickly get snapped up and bounce back based on fundamentals and a healthy dose of good hype.
Waiting and watching with this one atm.


Trade update accumulation zone INJ accumulation zone limit orders hit. We may move down to that bottom wick these are the day that you buy the dip. Next Stop $50.
NFA

Injective pullback targets if $37 range does not hold.To my disadvantage I've only been in and out of Injective, not a holder. If we do not hold the $37 range we should have some decent entry points.
The real question I want answered. Which asset will 10x in 2024? Is Injective a 10x candidate? For most investors, it is safer to assume a market cap of 50 will 10x than a market cap of 30. But when Ethereum was $750, who thought $4000 was possible?

Injective update BTC is moving down possibly to the support region. Now INJ looks like it will move into our accumulation zone before we blast off to $50.


corrective wave if plays out the corrective goes down to support level at 30. plus dollars before next waves back up to $45

Bounce Or Buy Zone Incoming Based on recent price of BTC will see a continuation of this correction estimated 1-5% drop.
As for injective, the market is giving us some possible opportunities. I have a few limit orders set for continued accumulation. I'm not buying a ton, just adding to my current size. Check the levels, Plan ahead and trade safe. Low-Medium Risk Trade Check All Levels, Plan in advance based on risk tolerance. Always us risk management, DYOR and NFA

INJUSD (D1) Buy stop at 43.9COINBASE:INJUSD INJUSD (D1)
Small range pattern after a long and strong price increase
Trading volume decreases during the price base and increases again when the price pushes up
Make a stop loss below the lowest point of the price base.
Buy Stop at 43.9
Stop loss at 36.9
TP will be updated continuously


$INJ- HYPEYou are either doing 2 things with $Injective right now..
1. taking profit from your investment if you got in as low as $2-7
2.Staking on some Defi protocols and position yourself for future airdrop rewards on new project being onboarded on Injective eco-system.
Don't just buy & hold your bag, make them earn you more money
Don't just buy and hold your bag, don't be greedy, take your profit. Rotate those profits and spread it to other potential assets.. (Dont ask which one..go through my ideas,i have been dropping them)

INJUSD Two sell signals for low risk profits.Injective (INJUSD) is rising aggressively within a 1-year Channel Up, currently on its 2nd Bullish Leg of the pattern, supported by both a Higher Lows (dashed) trend-line and the 1D MA50 (blue trend-line).
We expect it to peak on the Channel's top (Higher Highs trend-line) where we will short it, targeting 30.000. If however it breaks below the Higher Lows trend-line earlier, we will sell the break-out and target a potential contact with the 1D MA200 (orange trend-line) at 16.000.
-------------------------------------------------------------------------------
** Please LIKE 👍, FOLLOW ✅, SHARE 🙌 and COMMENT ✍ if you enjoy this idea! Also share your ideas and charts in the comments section below! This is best way to keep it relevant, support us, keep the content here free and allow the idea to reach as many people as possible. **
-------------------------------------------------------------------------------
💸💸💸💸💸💸
👇 👇 👇 👇 👇 👇

#injusd 1w Looks amazing in price discovery.Daily bullish pennant(purple) target is around 37,82 but weekly PRZ would probably be around 44,84 which would be a perfect place for shorts finally taking control. Because yellow symmetric triangle target will be complete at the same time with probable 1st wave inside of 3rd wave major count.

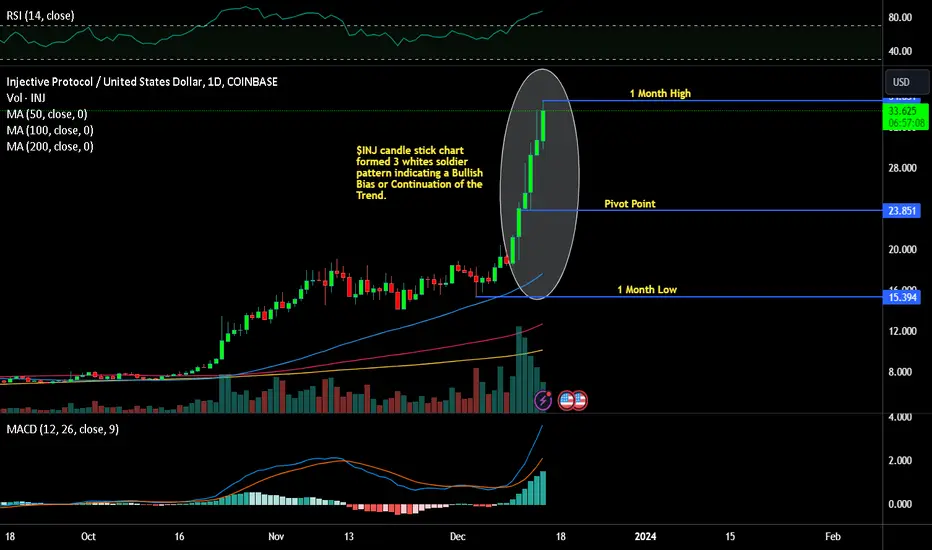
Injective (INJ) Integral 350% Increase from October to December
In 2023, INJ has seen an impressive 2000% growth, with a significant 350% increase from October to December. It recently reached a new all-time high of $33.4, and the buying momentum doesn't seem to be waning.
Maintaining the upward trajectory of Injective is key at the moment. Despite never having breached the $32.1-$33.4 resistance zone before, buyers might aim for new levels at $35 and $38, assuming BTC stabilizes above $42,000.
Any correction in INJ is likely to correlate with BTC's potential downturn. If BTC starts a downward trend, Injective could revisit its support zones at $28.5-$29.8, $26.6, and $23.6-$25.
INJUSD Has bottomed and is targeting 33.000Injective is on very stable technicals on the 1D timeframe (RSI = 61.927, MACD = 0.959, ADX = 21.734) as it resumed the rise, keeping clear of the 1D MA50, which remains the Support since since September 29th.
The 1D RSI shows that the market is replicating the early 2023 price action on a fractal which after reclaiming the 1D MA50, it rallied to the 1.5 Fibonacci extension. We therefore turn bullish again, aiming at the 1.5 Fib (TP = 33.000).
## If you like our free content follow our profile to get more daily ideas. ##
## Comments and likes are greatly appreciated. ##

INJ possible set-upINJ has been holding up strongly. 16.4 needs to hold in order to continue the positive trend and reach 18. A break of the the 100 SMA would break the trend and bring the price down to 15.3 or 14.1.

$INJ, downside and upside targets Looking to enter this trade on a final retest of support at $6.44 and then exit up in the $18-19 range.

INJ and Total Market Cap = GO TIME. LT3Inj is ready to go man. Now is time to get in where you fit in….
