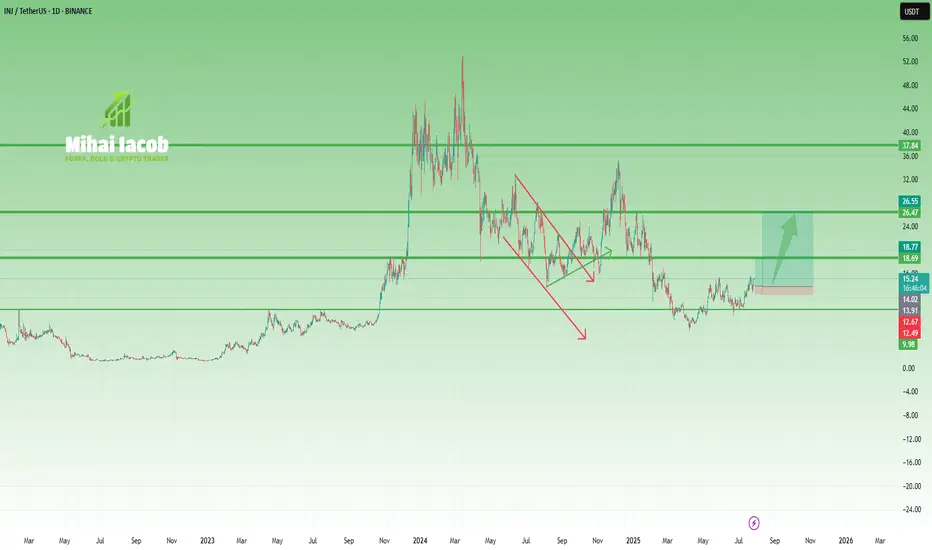
INJ – From Overhyped to Reasonable OpportunityA year and a half ago, INJ was in full hype mode, with fantasmagorical predictions of $200+, even though the coin had already done a 40x move.
(And not to brag—but at that moment, with INJ trading around $40, I said that $10 was far more likely than $200. It actually dropped to $6.5...)
Fast forwar
Related pairs
TradeCityPro | INJ Battles Key Resistance Amid Altseason Buzz👋 Welcome to TradeCity Pro!
In this analysis, I want to review the INJ coin for you. It’s one of the RWA and AI projects, currently ranked 63 on CoinMarketCap with a market cap of $1.51 billion.
📅 Daily Timeframe
On the daily timeframe, after a drop to the 6.94 level, this coin has bounced back and

INJ - Back Bullish!Hello TradingView Family / Fellow Traders. This is Richard, also known as theSignalyst.
📈INJ has been overall bullish trading within the rising wedge pattern marked in blue.
This week, INJ has been retesting the lower bound of the wedge.
Moreover, the green zone is a strong demand.
🏹 Thus, the

INJ Pushes Above $14.60, $34 Next?CRYPTOCAP:INJ is breaking out of a cup and handle pattern!
The price has pushed above the neckline around $14.60 after forming a clear cup and handle structure on the daily chart.
This is a bullish setup, and as long as INJ holds above the breakout zone, the momentum could continue.
A retest to

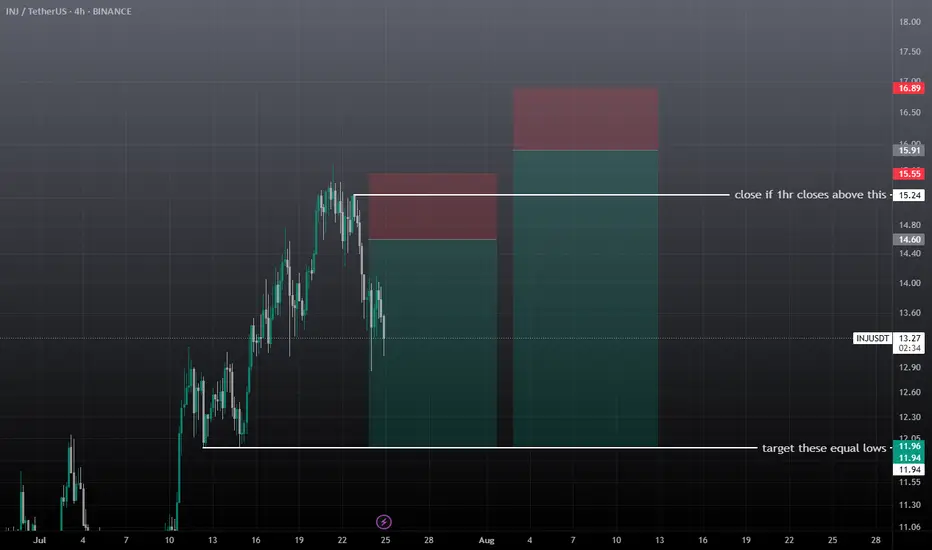
inj swing short setupWait for the entry, don't take it at current market price, entry can take time. There are two short setups forming on injusdt, after achieving the first entry if 1hr closes above the mentioned zone then close trade before sl, and then take the 2nd short setup, if tp achieves first then don't take th
Injective (INJ): Seeing 2x To Happen, Once Neckline Is BrokenINJ looks good and strong, about to either have an immediate BOS to form or have a smaller rejection and form a cup and handle pattern.
Nevertheless, we are bullish, and once we get that BOS, we are opening the long position here.
Swallow Academy

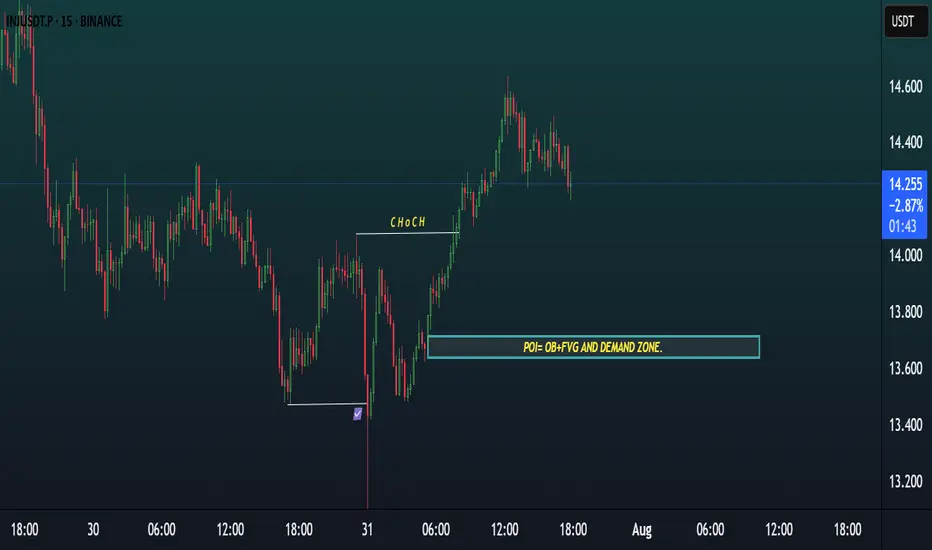
INJ 15m SETUPINJ/USDT 15m Setup 🔥
Market showed a clear Change of Character (ChoCH), confirming bullish momentum.
Now price is retracing toward a strong POI zone, which includes:
✅ Order Block (OB)
✅ Fair Value Gap (FVG)
✅ Demand Zone
📍 Waiting for price to tap this area for a high-probability long entry based
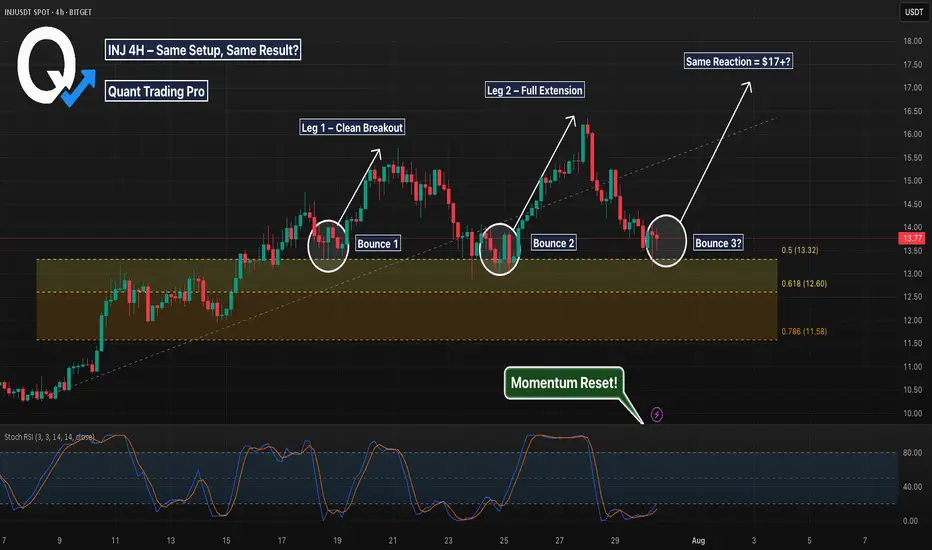
INJ 4H – Bounce Structure Repeating for a 3rd Time?INJ is showing one of the cleanest bounce structures we’ve seen all week.
Twice now, price has pulled back into this Fib zone (between the 0.5 and 0.618) and reversed cleanly — forming back-to-back legs up. Now we’re right back in that same golden pocket, with Stoch RSI fully reset and price showin
Long-Term Spot Technical Analysis of INJ CoinWhen evaluating INJ coin for long-term spot investments, it is evident that the price continues its downward movement after being rejected from the daily resistance level at $16.33. If INJ fails to receive a strong buying reaction from the $13.16 support in the coming days, the downtrend is likely t

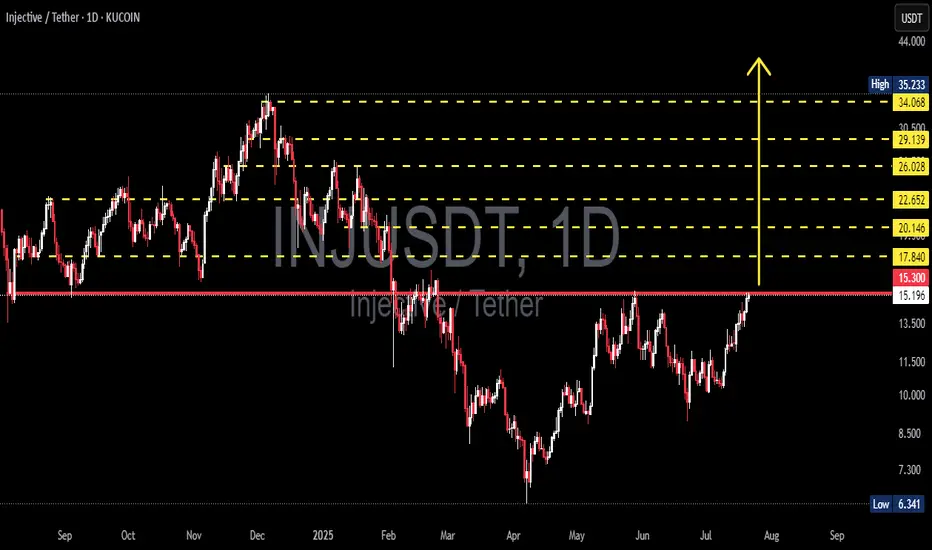
INJ/USDT at a Crucial Breakout Zone: Will the Path to $35 Unfold🧠 Full Technical Analysis (Daily Timeframe - KuCoin):
INJ/USDT (Injective Protocol) is currently at a critical decision point, testing a major resistance zone that has held strong since early 2025. After months of consolidation and a consistent structure of higher lows since May 2025, bullish press
See all ideas
Summarizing what the indicators are suggesting.
Oscillators
Neutral
SellBuy
Strong sellStrong buy
Strong sellSellNeutralBuyStrong buy
Oscillators
Neutral
SellBuy
Strong sellStrong buy
Strong sellSellNeutralBuyStrong buy
Summary
Neutral
SellBuy
Strong sellStrong buy
Strong sellSellNeutralBuyStrong buy
Summary
Neutral
SellBuy
Strong sellStrong buy
Strong sellSellNeutralBuyStrong buy
Summary
Neutral
SellBuy
Strong sellStrong buy
Strong sellSellNeutralBuyStrong buy
Moving Averages
Neutral
SellBuy
Strong sellStrong buy
Strong sellSellNeutralBuyStrong buy
Moving Averages
Neutral
SellBuy
Strong sellStrong buy
Strong sellSellNeutralBuyStrong buy
Displays a symbol's price movements over previous years to identify recurring trends.
Frequently Asked Questions
The current price of INJ / TetherUS (INJ) is 13.73 USDT — it has risen 1.31% in the past 24 hours. Try placing this info into the context by checking out what coins are also gaining and losing at the moment and seeing INJ price chart.
INJ / TetherUS price has risen by 0.36% over the last week, its month performance shows a 28.90% increase, and as for the last year, INJ / TetherUS has decreased by −40.77%. See more dynamics on INJ price chart.
Keep track of coins' changes with our Crypto Coins Heatmap.
Keep track of coins' changes with our Crypto Coins Heatmap.
INJ / TetherUS (INJ) reached its highest price on Mar 14, 2024 — it amounted to 53.00 USDT. Find more insights on the INJ price chart.
See the list of crypto gainers and choose what best fits your strategy.
See the list of crypto gainers and choose what best fits your strategy.
INJ / TetherUS (INJ) reached the lowest price of 0.18 USDT on Oct 21, 2020. View more INJ / TetherUS dynamics on the price chart.
See the list of crypto losers to find unexpected opportunities.
See the list of crypto losers to find unexpected opportunities.
The safest choice when buying INJ is to go to a well-known crypto exchange. Some of the popular names are Binance, Coinbase, Kraken. But you'll have to find a reliable broker and create an account first. You can trade INJ right from TradingView charts — just choose a broker and connect to your account.
Crypto markets are famous for their volatility, so one should study all the available stats before adding crypto assets to their portfolio. Very often it's technical analysis that comes in handy. We prepared technical ratings for INJ / TetherUS (INJ): today its technical analysis shows the neutral signal, and according to the 1 week rating INJ shows the neutral signal. And you'd better dig deeper and study 1 month rating too — it's sell. Find inspiration in INJ / TetherUS trading ideas and keep track of what's moving crypto markets with our crypto news feed.
INJ / TetherUS (INJ) is just as reliable as any other crypto asset — this corner of the world market is highly volatile. Today, for instance, INJ / TetherUS is estimated as 7.33% volatile. The only thing it means is that you must prepare and examine all available information before making a decision. And if you're not sure about INJ / TetherUS, you can find more inspiration in our curated watchlists.
You can discuss INJ / TetherUS (INJ) with other users in our public chats, Minds or in the comments to Ideas.