inj buy midterm"🌟 Welcome to Golden Candle! 🌟
We're a team of 📈 passionate traders 📉 who love sharing our 🔍 technical analysis insights 🔎 with the TradingView community. 🌎
Our goal is to provide 💡 valuable perspectives 💡 on market trends and patterns, but 🚫 please note that our analyses are not intended as buy o
Related pairs
INJUSDT Bulls Are Back! All-Time High Could Be Next!
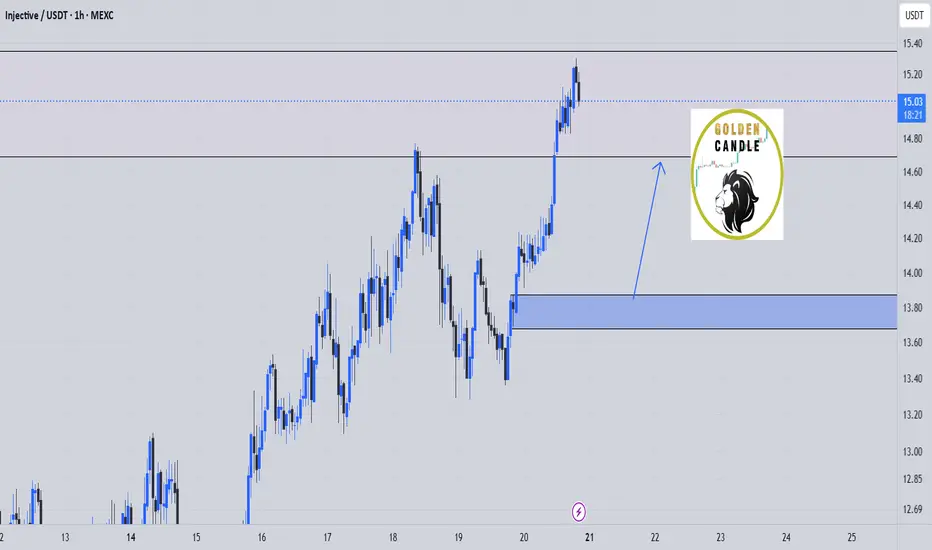
BINANCE:INJUSDT has shown a strong and clean bounce from a major support zone, indicating that buyers are stepping in aggressively at lower levels. This bounce reinforces the strength of the current uptrend and reflects growing bullish sentiment.
At the moment, the price is facing a significant re
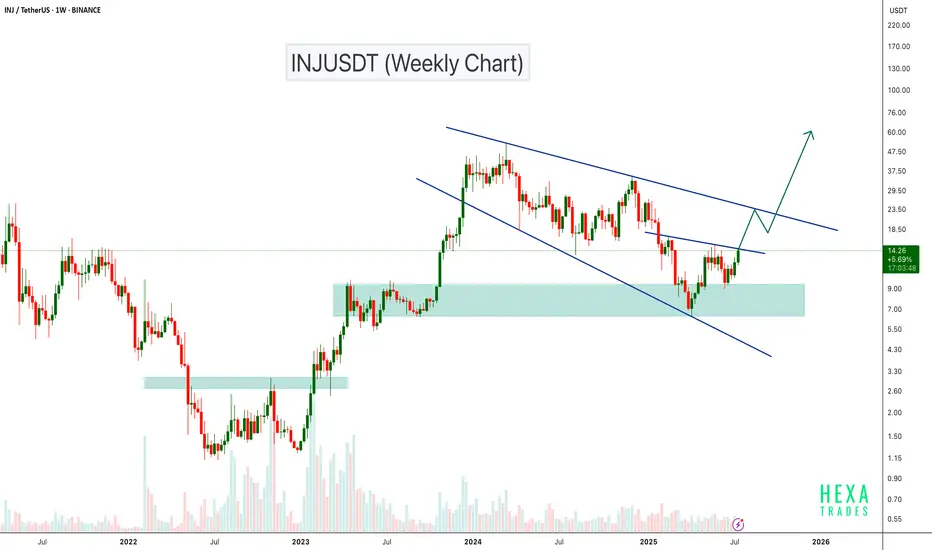
INJUSDT Approaching Key Wedge Resistance – Breakout Ahead?INJ is currently trading inside a broadening wedge pattern on the weekly timeframe. The price recently bounced strongly from the major demand zone around $8–$9, which has acted as a reliable support level in the past.
Now, INJ is approaching the upper resistance trendline of the broadening wedge. A
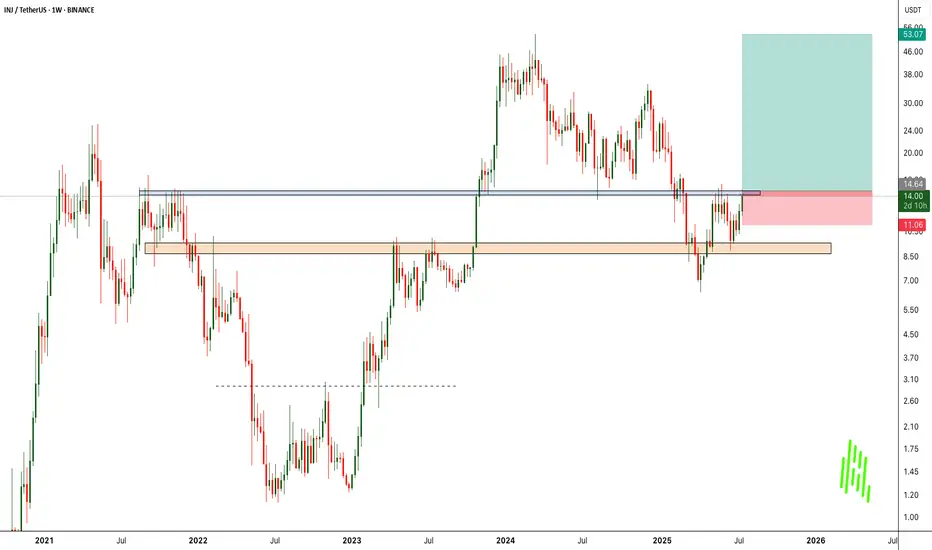
INJ/USDT -Macro Repeat in Motion?2023 was a phenomenal year for INJ, outperforming most of its competitors with an explosive +2800% rally, establishing it as a standout performer in the altcoin space.
Currently, we're observing a remarkably similar structure building on higher timeframes — consolidation, accumulation, and early br

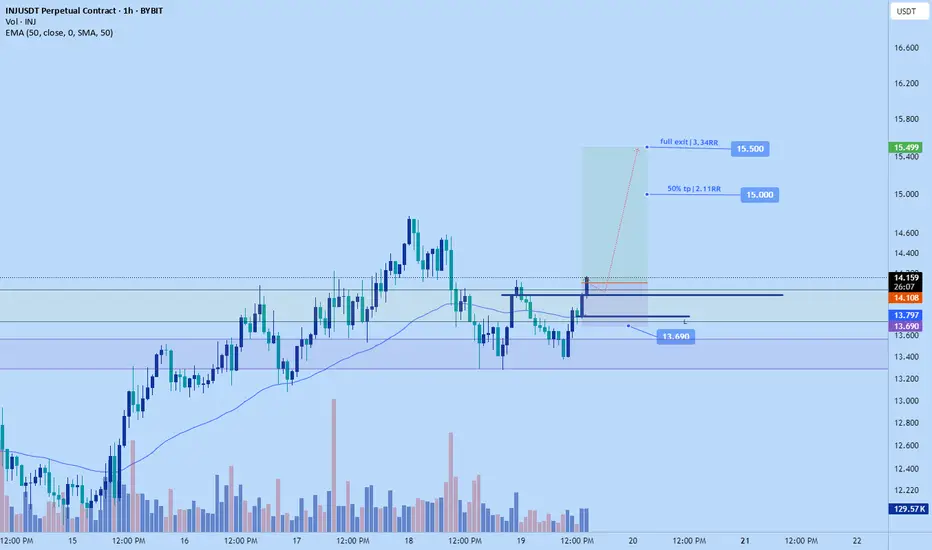
INj pump to $15.5 soonNew long position for INJ
Stop: $13.69
Tp1: 15----50% tp
Exit: $15.5
DTT strategy applied.
Inj long to $15.5 today!Stoploss: $14
Tp: $15.5
Inj been pushing impulsively. Seems to me the market is targeting 15.5 area. Uptrend is in tact on lower tf and at good demand areas to create next HL to push.
Time sensitive.
DTT analysis applied- Learn more on my x profile.

INJ Breakout above bull flag.CRYPTOCAP:INJ BULL FLAG CAN BREAKOUT ABOVE 37$ HERE! 🚀
My targets for the breakout are 50$ and 66$.📈

INJ/USDT Weekly Outlook – Holding the Golden Zone!
📊 Complete Technical Analysis:
INJ/USDT is currently sitting at a critical weekly demand zone between $7.50 – $9.00, an area that has consistently triggered strong bullish reversals since mid-2022. This yellow zone represents a historical accumulation range, where buyers have stepped in aggressive

INJ Bullish Harmonic Pattern Setup – Breakout Loading?Hey traders! 👋
#INJ is forming a classic bullish harmonic pattern on the 1D timeframe, and what’s exciting is — no bearish divergence or rejection signals yet!
🔍 Key Technical:
Currently respecting the harmonic structure perfectly
B Point at $16 is acting as a major resistance
No bearish signs =

INJUSDT 1D#INJ has formed a Cup and Handle pattern on the daily chart. All eyes are on the neckline — a breakout above it could trigger a 200–250% move. Enter this coin only after confirmation. Targets after the breakout:
🎯 $17.28
🎯 $20.48
🎯 $23.68
🎯 $28.23
🎯 $34.03
⚠️ Always use a tight stop-loss and pract

See all ideas
Summarizing what the indicators are suggesting.
Oscillators
Neutral
SellBuy
Strong sellStrong buy
Strong sellSellNeutralBuyStrong buy
Oscillators
Neutral
SellBuy
Strong sellStrong buy
Strong sellSellNeutralBuyStrong buy
Summary
Neutral
SellBuy
Strong sellStrong buy
Strong sellSellNeutralBuyStrong buy
Summary
Neutral
SellBuy
Strong sellStrong buy
Strong sellSellNeutralBuyStrong buy
Summary
Neutral
SellBuy
Strong sellStrong buy
Strong sellSellNeutralBuyStrong buy
Moving Averages
Neutral
SellBuy
Strong sellStrong buy
Strong sellSellNeutralBuyStrong buy
Moving Averages
Neutral
SellBuy
Strong sellStrong buy
Strong sellSellNeutralBuyStrong buy
Displays a symbol's price movements over previous years to identify recurring trends.
Frequently Asked Questions
The current price of INJ / USDT Spot Trading Pair (INJ) is 15.033 USDT — it has risen 0.49% in the past 24 hours. Try placing this info into the context by checking out what coins are also gaining and losing at the moment and seeing INJ price chart.
INJ / USDT Spot Trading Pair price has risen by 21.58% over the last week, its month performance shows a 38.07% increase, and as for the last year, INJ / USDT Spot Trading Pair has decreased by −45.23%. See more dynamics on INJ price chart.
Keep track of coins' changes with our Crypto Coins Heatmap.
Keep track of coins' changes with our Crypto Coins Heatmap.
INJ / USDT Spot Trading Pair (INJ) reached its highest price on Mar 14, 2024 — it amounted to 52.910 USDT. Find more insights on the INJ price chart.
See the list of crypto gainers and choose what best fits your strategy.
See the list of crypto gainers and choose what best fits your strategy.
INJ / USDT Spot Trading Pair (INJ) reached the lowest price of 1.123 USDT on Jul 13, 2022. View more INJ / USDT Spot Trading Pair dynamics on the price chart.
See the list of crypto losers to find unexpected opportunities.
See the list of crypto losers to find unexpected opportunities.
The safest choice when buying INJ is to go to a well-known crypto exchange. Some of the popular names are Binance, Coinbase, Kraken. But you'll have to find a reliable broker and create an account first. You can trade INJ right from TradingView charts — just choose a broker and connect to your account.
Crypto markets are famous for their volatility, so one should study all the available stats before adding crypto assets to their portfolio. Very often it's technical analysis that comes in handy. We prepared technical ratings for INJ / USDT Spot Trading Pair (INJ): today its technical analysis shows the buy signal, and according to the 1 week rating INJ shows the buy signal. And you'd better dig deeper and study 1 month rating too — it's sell. Find inspiration in INJ / USDT Spot Trading Pair trading ideas and keep track of what's moving crypto markets with our crypto news feed.
INJ / USDT Spot Trading Pair (INJ) is just as reliable as any other crypto asset — this corner of the world market is highly volatile. Today, for instance, INJ / USDT Spot Trading Pair is estimated as 1.54% volatile. The only thing it means is that you must prepare and examine all available information before making a decision. And if you're not sure about INJ / USDT Spot Trading Pair, you can find more inspiration in our curated watchlists.
You can discuss INJ / USDT Spot Trading Pair (INJ) with other users in our public chats, Minds or in the comments to Ideas.