INJUSDT Bulls Are Back! All-Time High Could Be Next!
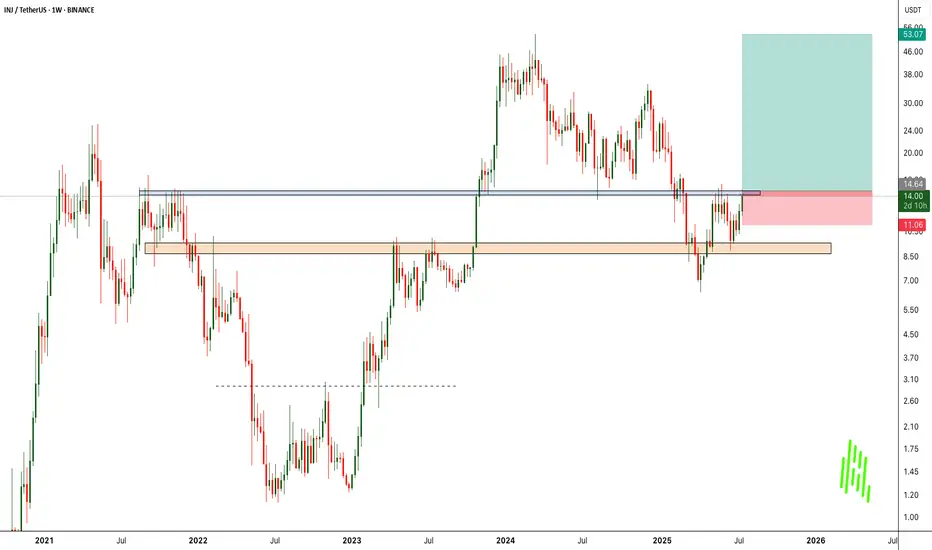
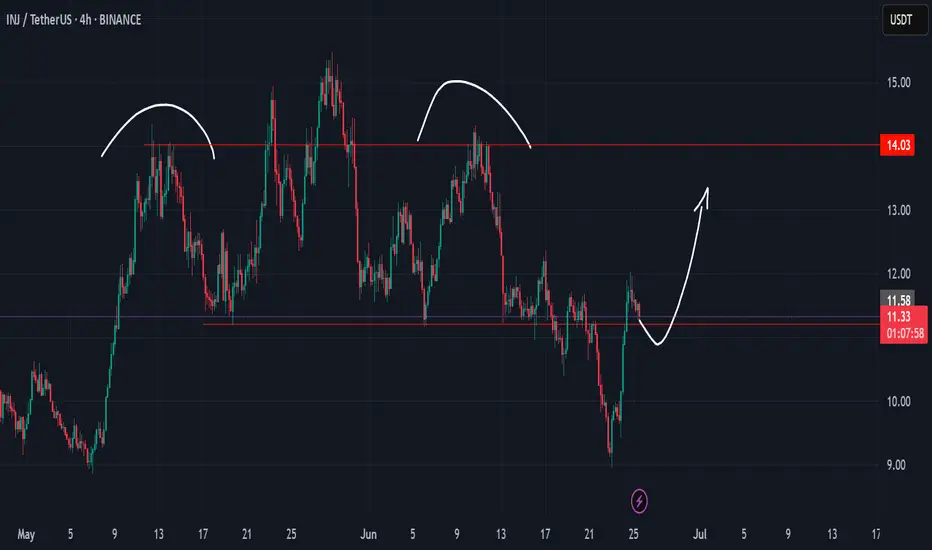
BINANCE:INJUSDT has shown a strong and clean bounce from a major support zone, indicating that buyers are stepping in aggressively at lower levels. This bounce reinforces the strength of the current uptrend and reflects growing bullish sentiment.
At the moment, the price is facing a significant resistance level. This area has previously acted as a barrier, but with increasing volume and momentum, we expect BINANCE:INJUSDT to break out from this resistance and continue its upward move.
If the breakout occurs, our target is the previous all-time high, as there is limited resistance above the current zone. This presents a high-reward opportunity for traders looking for breakout setups.
As always, managing risk is key. Use a well-placed stop loss below the support level to protect your capital. Breakouts can be explosive, but discipline and proper risk management make all the difference.
BINANCE:INJUSDT Currently trading at $14.4
Buy level : Above $14.5
Stop loss : Below $11
Target 1: $20
Target 2: $35
Target 3: $40
Target 4: $53
Max leverage 2x
Always keep stop loss
Follow Our Tradingview Account for More Technical Analysis Updates, | Like, Share and Comment Your thoughts
INJUSDT trade ideas
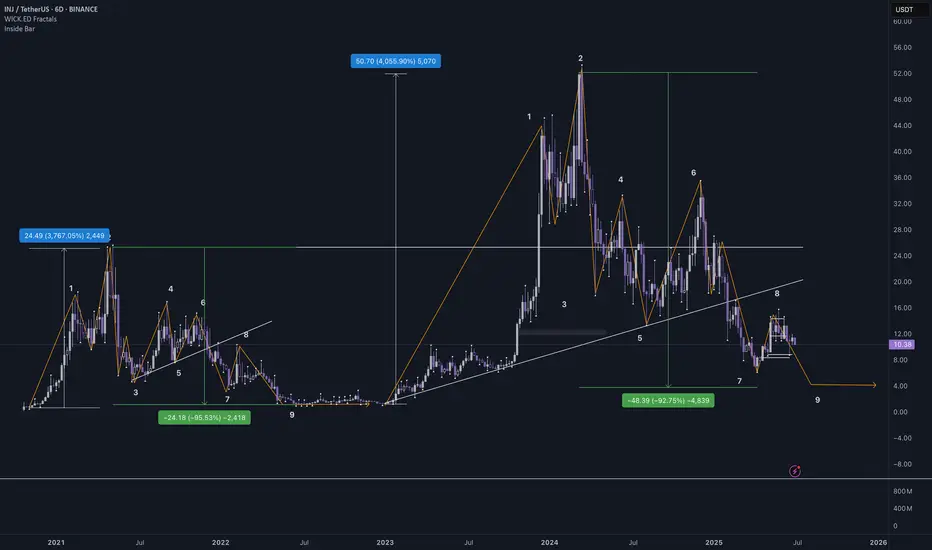
INJ/USDT -Macro Repeat in Motion?2023 was a phenomenal year for INJ, outperforming most of its competitors with an explosive +2800% rally, establishing it as a standout performer in the altcoin space.
Currently, we're observing a remarkably similar structure building on higher timeframes — consolidation, accumulation, and early breakout patterns that mirror the pre-rally phase of 2023. This raises a high-probability scenario: Is INJ preparing to repeat history?
With strong support forming at key levels and a tightening price range, any decisive breakout could trigger a significant leg up. If momentum follows through, our first macro target is the previous all-time high (ATH) around $48–$52, with further upside potential in price discovery zones.

INJ Breakout above bull flag.CRYPTOCAP:INJ BULL FLAG CAN BREAKOUT ABOVE 37$ HERE! 🚀
My targets for the breakout are 50$ and 66$.📈

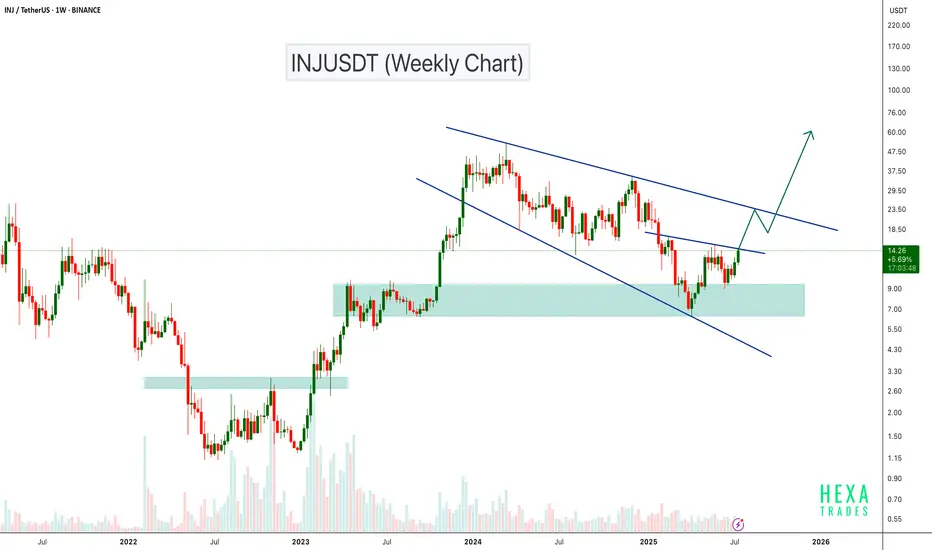
INJUSDT Approaching Key Wedge Resistance – Breakout Ahead?INJ is currently trading inside a broadening wedge pattern on the weekly timeframe. The price recently bounced strongly from the major demand zone around $8–$9, which has acted as a reliable support level in the past.
Now, INJ is approaching the upper resistance trendline of the broadening wedge. A confirmed breakout above this level could lead to a strong bullish move, potentially targeting the $50 level.
Cheers
Hexa
CRYPTOCAP:INJ BINANCE:INJUSDT
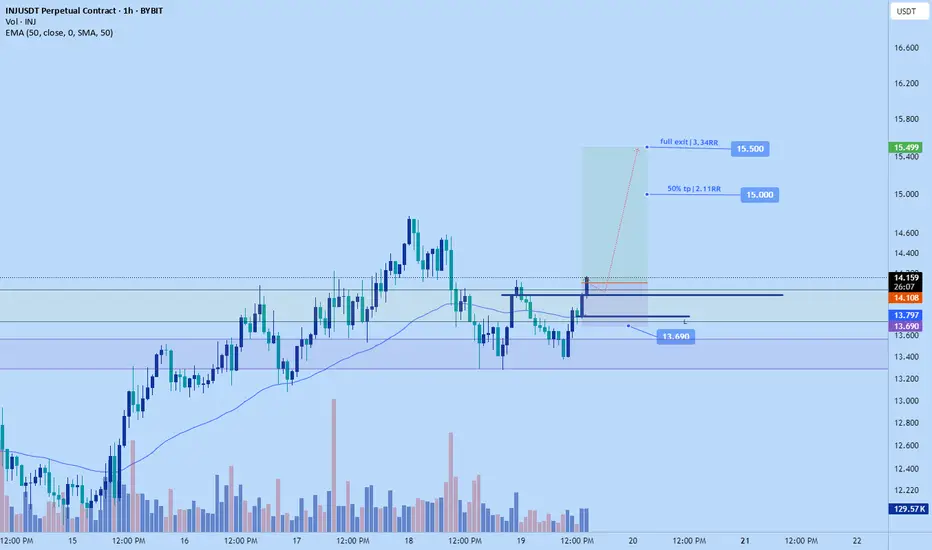
INj pump to $15.5 soonNew long position for INJ
Stop: $13.69
Tp1: 15----50% tp
Exit: $15.5
DTT strategy applied.
Inj long to $15.5 today!Stoploss: $14
Tp: $15.5
Inj been pushing impulsively. Seems to me the market is targeting 15.5 area. Uptrend is in tact on lower tf and at good demand areas to create next HL to push.
Time sensitive.
DTT analysis applied- Learn more on my x profile.

INJ/USDT Weekly Outlook – Holding the Golden Zone!
📊 Complete Technical Analysis:
INJ/USDT is currently sitting at a critical weekly demand zone between $7.50 – $9.00, an area that has consistently triggered strong bullish reversals since mid-2022. This yellow zone represents a historical accumulation range, where buyers have stepped in aggressively during past dips.
The structure is forming a potential Double Bottom or even a base accumulation pattern, which often precedes explosive upward movements.
🟢 Bullish Scenario (Optimistic Outlook):
If price continues to hold above this key support, a bullish reversal is highly probable.
🔼 Upside Targets:
1. First Target: $12.97 – initial resistance level
2. Mid Target: $16.12 – previously a strong distribution zone
3. Major Target: $32.75 to $43.09 – major resistance from the last peak phase
💡 Bullish Confirmation:
Weekly candle closes above $12.97 with volume
Bullish price action near the support zone
Formation of higher lows on the weekly chart
Once price breaks above $16.12, INJ could accelerate toward the $30–$40 range.
🔴 Bearish Scenario (Caution Required):
However, if price breaks down below the $9.00 support zone with strong volume and a full-bodied weekly candle close, downside risk increases.
🔽 Bearish Targets:
$7.50 – psychological support
$5.00 – deeper support zone
$1.12 – extreme scenario (previous macro bottom)
⚠️ Bearish Signs:
Strong rejection at $12.97
Weekly close below the yellow demand zone with significant sell volume
📉 Market Psychology & Pattern Insight:
The market is in a highly emotional phase, but accumulation signs are visible.
Retail traders may panic near $9.00, but smart money often buys quietly in these zones.
This is a "patience zone" — where big moves are quietly prepared before launching.
📎 Conclusion:
> INJ is currently testing a powerful historical support zone. A breakout above $12.97 could trigger a multi-leg rally toward $30–$43. However, a breakdown below $9.00 would invalidate the bullish setup and call for caution.
#INJUSDT #CryptoAnalysis #AltcoinBreakout #TechnicalAnalysis
#SupportAndResistance #BullishSetup #BearishScenario #DoubleBottom
#PriceAction #CryptoTrading

INJ - Injective Protocol - Daily Chart OpinionsHere’s a detailed **technical analysis** of the chart you uploaded for **INJ/USDT (Injective Protocol)** on the **1D (Daily) timeframe** using **Heikin Ashi** candles and the **WaveTrend Cross Indicator (WT\_CROSS\_LB)**:
---
📊 **Current Price Zone:**
* **Current Price:** \~\$13.59
* **Sell/Buy Spread:** \$14.18 Sell / \$14.19 Buy
* **Daily Range:** \$12.83 – \$14.06
* **Volume:** Moderate, slightly increasing on green candles — showing growing interest.
---
📈 **Price Structure (Heikin Ashi Candles):**
* Recent series of **strong green candles** — Heikin Ashi confirms trend direction well.
* Steady **bullish momentum** after the reversal from \~\$8.5–9.0 zone in late May.
* Price has formed a **higher low** and now attempting a **higher high**, indicating a potential trend reversal.
---
📉 **WT\_CROSS\_LB (WaveTrend Oscillator):**
* **WaveTrend lines are surging upward**, indicating **strong bullish momentum**.
* Green dot confirmed around mid-June (early entry signal).
* The oscillator is now approaching the **+60 zone** — nearing **overbought territory**, so a short-term pullback could happen soon.
* Previous tops at similar levels have resulted in **minor corrections**, so watch closely for divergence or exhaustion.
---
🧱 **Support & Resistance Levels:**
* **Immediate Support:** \$11.20 – \$12.00 range (recent base)
* **Current Resistance Zone:** Around \$14.50–\$15.00
* **Major Resistance Ahead:** \$17.50 and \$20.00 (psychological round numbers)
* **Macro Resistance:** \~\$26 and \$35 (based on previous highs)
---
🔄 **Trend Overview:**
* **Short-Term:** Bullish (higher lows, strong momentum)
* **Medium-Term:** Reversal in progress — needs a break above \$15 for confirmation.
* **Long-Term:** Still under macro resistance (\~\$20+), but shaping into recovery mode after long downtrend.
---
⚠️ **Key Risks & Notes:**
* WaveTrend is nearing overbought → watch for divergence or volume drop.
* Macro resistance levels remain strong — sentiment shift or BTC weakness could drag it back.
---
✅ Summary:
INJ is showing **early bullish structure**, with momentum indicators supportive of further upside.
It’s approaching resistance near \$14.5–15.0, which, if broken, could open up room toward \$17 and beyond.
A small consolidation/pullback is healthy here.
Volume and broader market sentiment will be critical to watch.
--
Disclosures:
This analysis is for informational purposes only and is not financial advice. It does not constitute a recommendation to buy, sell, or trade any securities, cryptocurrencies, or stocks. Trading involves significant risk, and you should consult with a qualified financial advisor before making any investment decisions. Past performance is not indicative of future results.

INJ short target: $10Stop: $10.630
Last Tp: $10.00
50% partial tp 1: $10.165
25% tp: $10.061
Full close: $10.00
Strategy: DTT

inj buy long setup, scalp intraday setupTake it tension free sl is very tigh, wick below the sl doesn't matter candle closed then setup is invalid. If tp hits without filling entry then setup is not valid

INJUSDT Forming Bullish PennantINJUSDT has recently emerged as one of the more promising crypto pairs to watch, attracting significant investor interest with strong trading volume. While no specific pattern is clearly defined on the chart right now, the market structure indicates that accumulation is happening at key support zones, hinting at a potential bullish breakout. Traders expecting an 80% to 90%+ gain see this as an opportunity to ride a strong upward trend as Injective Protocol continues to grow in the decentralized finance (DeFi) sector.
Injective Protocol (INJ) is well-known for its innovative approach to decentralized derivatives trading, offering a fully decentralized layer-2 exchange and robust DeFi ecosystem. As the crypto market shifts focus towards real utility projects, INJ stands out due to its unique value proposition and active developer community. This strong fundamental backing is one of the reasons investors are accumulating positions now before any major breakout happens.
Technically, INJUSDT is poised for a move once it clears resistance levels that have capped its price in recent months. Increasing volume suggests that traders are building positions in anticipation of a breakout, which could be fueled by positive news or broader crypto market momentum. Keep an eye on potential catalysts like protocol upgrades, partnerships, or DeFi adoption that could propel INJUSDT towards its projected gain.
✅ Show your support by hitting the like button and
✅ Leaving a comment below! (What is You opinion about this Coin)
Your feedback and engagement keep me inspired to share more insightful market analysis with you!

INJ Long Swing Setup – Structural Recovery with SMA ReclaimINJ has retraced to a key support zone and is showing early signs of recovery, reclaiming its 20-day SMA. With structural strength returning, the $11.00–$11.60 range offers a solid swing entry—contingent on BTC holding key levels.
📌 Trade Setup:
• Entry Zone: $11.00 – $11.60
• Take Profit Targets:
o 🥇 $14.00 – $16.00
o 🥈 $19.80 – $23.00
• Stop Loss: Daily close below $9.50 (Exit early if BTC breaks major support)

INJ - Back from the Dead?Hello TradingView Family / Fellow Traders. This is Richard, also known as theSignalyst.
INJ has been hovering within a wide range between our two green zones, spanning from $10 to $16.
For the bulls to take control in the medium term, a break above the last major high marked in blue is needed.
To confirm long-term bullish dominance, a breakout above the upper boundary of the green range is required.
📚 Always follow your trading plan regarding entry, risk management, and trade management.
Good luck!
All Strategies Are Good; If Managed Properly!
~Rich

#INJ/USDT#INJ
The price is moving within a descending channel on the 1-hour frame and is expected to break and continue upward.
We have a trend to stabilize above the 100 moving average once again.
We have a downtrend on the RSI indicator that supports the upward move with a breakout.
We have a support area at the lower limit of the channel at 0.04263, acting as strong support from which the price can rebound.
Entry price: 10.70
First target: 11.11
Second target: 11.43
Third target: 11.86

inj swing trade setupInj has broken downside, expecting more downfall before any leg up, wait for the entries to be filled, these are swing trades based on 1 day TF, so here wick doesn't matter wait for the closing, you can hold them without SL if entry achieved, take 1st entry on mentioned points 2nd entry below SL, and then wait for the closing, IF any entry achieved and candle closed above the short then wait for the pullback and close on entry points if long entry achieved then hold the trade 2nd entry take from previous wick low and wait for the tp this leg down will be the final shakeout before any major move. That's why giving you some short entries. BTC will take a final leg down sooner or later, then Boom your alt season starts.

INJUSDTIt seems that we will not see altseason at least this year.
In best case +100%-150% for alts
and 4k for ETH (this summer)
Injective (INJ): Let's Fill Both CME Gaps | Volatility IncomingInjective coin has had a decent upward movement where price left behind a pretty nasty bearish CME gap, which we are intending to see filled here. Once we see the fill of it, we are going to look for BOS, but if we see that buyers will overtake current zones strongly, then we will be looking for an early BOS, which would give us a good entry for long towards upper CME.
Swallow Academy

Long Inj 10.4-10.5 longWatch reaction 10.4-10.5 long
Entry: 10.4-10.5
TP1: $10.90–11.00
TP2: $11.20 (moderate)
TP3: $11.50–11.55 (ambitious if volume confirms)
SL: $10.50 (tight) or $10.40 (conservative)
Keep an eye on volume and broader crypto market movements—strength in Bitcoin or Ethereum can give your long more lift. Always follow your risk management rules.

INJ Long Swing Setup – Breakout Retest Opportunity at Key LevelIf the crypto market pushes higher and INJ flips current resistance into support, we’ll be looking to enter on a retest of the $11.60 zone. This level could act as a launchpad for the next leg up.
📌 Trade Setup:
• Entry Zone: $11.60 – $11.60 (Breakout Retest)
• Take Profit Targets:
o 🥇 $14.20 – $16.25
o 🥈 $19.80 – $23.00
• Stop Loss: Daily close below $10.70


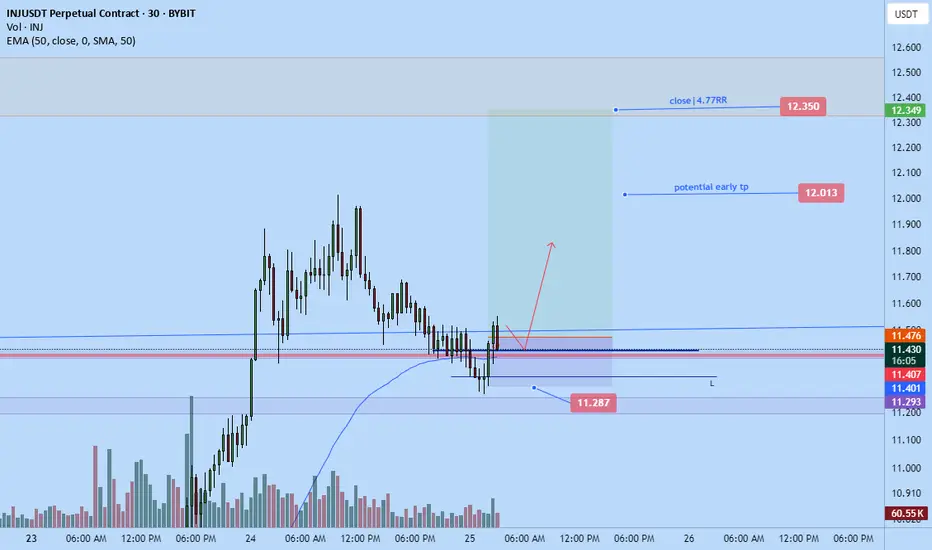
INJ LONg to $12.35I just opened a long position on INJ not too long ago. Targeting $12.35. Anticipating a strong push today. To clear the prior daily LH. Monthly candle closing in a few days and market looks like it wants to close it bullish.
Right now expecting a quick retest on ltf like 15-30 minutes before pump higher
Injective Enters the Daily Bouncing AreaCRYPTO:INJUSD has tapped into the equal legs zone at $9.99–$8.97, a key Fibonacci-based support area where buyers may begin to step in. This zone often acts as a magnet for a reaction higher, especially if the broader structure supports a bullish reversal.
In the coming weeks, watch for confirmation signals — a strong bounce from this zone could kick off the next leg up.
