Is #INJUSDT Poised for a Major Bullish Breakout? Don't Miss ThesYello, Paradisers!Have you been tracking #INJUSDT lately? There's a major bullish continuation from support that could be just around the corner. Let's dive into the details!
💎 After a careful analysis of #INJECTIVE price action, we've observed a promising pattern. For a long time, CRYPTOCAP:INJ has been adhering to a descending trendline. Recently, it successfully broke above this trendline and resistance at $21.41, turning this level into support. If #INJ sustains momentum at this support, there is a high probability it will first target resistance at $23.41.
💎 However, due to previous strong bearish pressure, there's an imbalance in the price. It's likely that the price might revisit this level to fill the imbalance. If CRYPTOCAP:INJ fails to initiate an upward movement from the retest level of support, we should look for a bullish rebound from the lower demand at $18.94. On the flip side, if the price breaks below the $18.94 demand, this could invalidate the bullish setup and lead to further declines.
Stay sharp and trade smart, Paradisers! Stay disciplined and focused on your trading strategy.
MyCryptoParadise
iFeel the success🌴
INJUSDT trade ideas

INJ 400% move by November 2024Quite easy to get confluence on this chart
Some basic ideas in trends and channel expectations meet with fib extensions and trend based fib.
Targets depicted on chart at the 1.618 and 1:1 and channel line (measured from wave 2 and 4 and transposed to W3)
100-130 should be easily met in the coming months


INJ - Full Bear Mode?I've been bullish on INJ until the M-Pattern formed - which has since taken us into a bearish correction. There is ONE zone that remains our final hope for a new ATH, but if we cannot hold this support then INJ is full on bearish for the immediate future.
Let's take a look at key zones for buying orders as well as the INJBTC chart for insights.
Here's an alt that is instead moving into accumulation as discussed in the video:
_____________________________
BINANCE:INJUSDT BINANCE:INJBTC BINANCE:OPUSDT

smart money concept analysissmart money concept analysis: Don't get caught in whale traps. What do you think of this idea? What is your opinion? Share it in the comments📄🖌 If you like the idea, please give it a like. This is the best "Thank you!" for the author

INJUSD market Bullish Direction money heist planMy Dear Robbers / Traders,
This is our master plan to Heist INJUSD Market based on Thief Trading style Technical Analysis.. kindly please follow the plan I have mentioned in the chart focus on Long entry. Our target is Red Zone that is High risk Dangerous level, market is overbought / Consolidation / Trend Reversal at the level Bearish Robbers / Traders gain the strength. Be safe and be careful and Be rich.
Note: If you've got a lot of money you can get out right away otherwise you can join with a swing trade robbers and continue the heist plan, Use Trailing SL to protect our money.
Stop Loss : Recent Swing Low using 2h timeframe
Warning : Fundamental Analysis comes against our robbery plan. our plan will be ruined smash the Stop Loss. Don't Enter the market at the news update.
Loot and escape on the target 🎯 Swing Traders Plz Book the partial sum of money and wait for next breakout of dynamic level / Order block, Once it is cleared we can continue our heist plan to next new target.
support our robbery plan we can easily make money & take money 💰💵 Join your hands with US. Loot Everything in this market everyday make money easily with Thief Trading Style.

INJUSDT Potential DownsidesHey Traders, in today's trading session we are monitoring INJUSDT for a selling opportunity around 22 zone, INJUSDT is trading in a downtrend and currently is in a correction phase in which it is approaching the trend at 22 support and resistance area.
Trade safe, Joe.

INJ ANALYSIS🔮 #INJ Analysis 🚀🚀
In daily timeframe, falling wedge pattern is forming ✅
Right now, #INJ trading around its major support zone and at a point from where #INJ has already taken reversal 🚀 🚀 if #INJ breaks the pattern then we will be target for 100-150% in few weeks. 💸 💯🚀
💸Current Price -- $19.88
📈Target Price -- $30.68...$50.63
⁉️ What to do?
- We have marked crucial levels in the chart . We can trade according to the chart and make some profits. 🚀💸
#INJ #Cryptocurrency #DYOR

Injective- Good buy for 50% riseBack in winter, when everyone was super bullish and the hype around some coins, particularly INJ, was incredible, I predicted that the coin could drop to 20.
Indeed, since then, INJ/USDT has dipped into that zone several times and even fell below 20 recently.
Although I don't see INJ reaching 100 or achieving the lofty multipliers that some people dream of when trading crypto, I believe this is a good opportunity for a buy trade with a potential 50% gain.
Technically, the 20 zone is now a very strong support level and also coincides with an old congestion zone, which should provide additional support.
In conclusion, I'm looking to buy around 20, and by setting a stop loss just below the recent spike down, a risk-to-reward ratio of more than 1:2 could be achieved with this trade.

Trade Setup: INJ at $18 SupportMarket Context:
INJ has retested the $18 support level, with buyers visibly defending this area. This support sweep indicates potential bullish momentum. If the price loses this support, wait for it to turn into a deviation before buying at this level off a higher high, then a higher low. Ideally, the price should consolidate above $22 and then break to the upside from here.
Trade Setup:
Entry: Enter a trade at $20.
Take Profit: Set profit targets at $25.50 and $30.
Stop Loss: Place the stop loss below $18 on a daily close.
📊 Monitor the price action closely and adjust your strategy accordingly! #INJ #CryptoTrading #SupportAndResistance 🎯

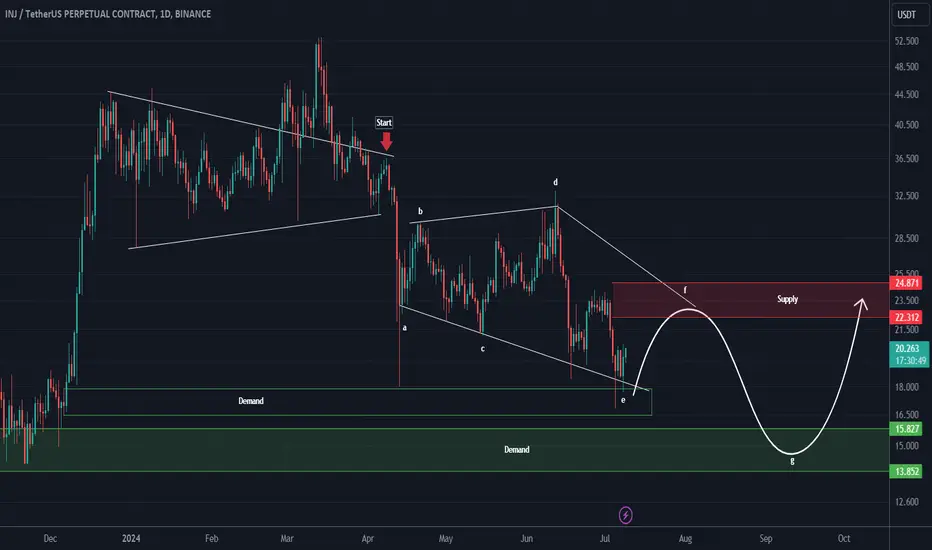
INJ UPDATE (buy and sell setup)Before anything else, we warned inj holders at the top price that the bullish waves are over and the big inj correction is about to begin. (You can see it in the "related ideas" section)
Now we have prepared an update for inj.
From where we placed the red arrow on the chart, the INJ correction has started. It seems that we have a zigzag diametric on the chart.
We will look for sell/short positions in the red range and buy/long positions in the green range.
If a daily candlestick closes above the red range or below the green range, the analysis will be violated
For risk management, please don't forget stop loss and capital management
Comment if you have any questions
Thank You
INJUSDT Potential DownsidesHey Traders, in today's trading session we are monitoring INJUSDT for a selling opportunity around 21.10 zone, INJUSDT is trading in a downtrend and currently is in a correction phase in which it is approaching the trend at 21.10 support and resistance area.
Trade safe, Joe.

I'm Back- New Strategy - Different mentality - Let's goBACK BETTER THEN EVER! My new indicator are maaaad!
Green = Normal bull / Yellow = Strong Bull
Red = Normal Bear / Blue = Strong Bear
BINANCE:INJUSDT

Injective / INJ analysis The price of Injective is $2.28 today with a 24hour trading volume of 140 million dollar. This represents a 20% price increase in the last 24 hours and a 70% price increase in the past 30 days.
Injective is a blockchain built for finance. It is an open, interoperable layer1 blockchain powering next-gen DeFi applications, including decentralized spot and derivatives exchanges, prediction markets, lending protocols.
they had pretty busy week, first a mainnet upgrade then Astroport beta launched on Injective,they processed over 150M transactions and burned 5,639,832.45 total INJ too.
Inj bulls couldn't break 2.5 resistance but the daily candle still is green means bulls still got chance, for short term 2.5, 2.9 and 3.5$ are targets.
1.5$ is a dip level for Inj and good opportunity for investors

INJUSDT Potential DownsidesHey Traders, in today's trading session we are monitoring INJUSDT for a selling opportunity around 23.25 zone, INJUSDT for a selling opportunity around 23.25 zone, INJUSDT is trading in a downtrend and currently is in a correction phase in which it is approaching the trend at 23.25 support and resistance area.
Trade safe, Joe.

$INJ injective trade analysis BINANCE:INJUSDT <> monthly chart 📉📈 analysis ⏰ DYOR
( Support ✨ and share my article with your frnds ❤️🔥 , follow article for intresting updates )
$18 - $15 > high level resistance time of 2021 , now act's like " SUPPORT "
📌 Month below close is invalid
I am expecting potential accumulation range , here
🎯 $150 ....... ‼️ Target
..... i know, this coin is potential to do much more target's .
But ,
Let the coin to complete it's main thing's, later we can discuss

Holding two significant support levelsCompared to other altcoins, Injective has shown stronger performance, holding two significant support levels at $18 and $20. In the medium term, it has the potential to move towards the $24 to $28 range.

Injective Protocol Flashes Buy Signal On The Daily Chart — 16% 👉 Here's What Has Happened
printed a bullish MACD crossover on the daily chart. Simplified speaking, this happens when a shorter-term moving average moves above a longer-term average. Practically, it tells you that the token is getting some upward momentum, which likely leads to a further price increase.
ℹ️ Signal Details
The signal flashed on the daily chart and had extraordinary backtest results. Based on 30 historical signals, INJ gained more than 10% after signals has flashed in 80%. Moreover, the MACD is usually a good indicator on the daily chart — when specific aspects apply 👇
💹 Other Technical Indicators
Most momentum indicators are in the neutral zone and, therefore, support the signal. Many trend indicators have turned bullish or are about to turn bullish. The weak ADX should be monitored closely since we want to have the signal backed by a strong trend.
📉 What about the chart
INJ's 1D chart perfectly supports the signal. INJ has found strong support at $20 and bounced nicely. The profit potential of the signal aligns with the next resistance at 27-28.

INJ USDT Looking Bearish if break the channelINJ USDT looing bearish if broke the channel which is mentioned in the chart, i suggest to place the Stoplimit sell order to go with the trend

Bullish Divergence RSIMonday 24:th of June INJ printed Bullish Divergence on RSI, comfirmed same day. Piossible trend-reversal.

INJ Most Disappointed one in a million I really upset about INJ because it couldn't be able to pick its performance.
If we are in the last phase I expect INJ to go up around 32 without any accumulation.

$INJIf it rejected then we can go for short position.
We need confirmation on it but my priority is rejected/short

INJ Short planINJ Short Plan:
INJ has broken the trend line on the higher time frame (HTF) and is currently retesting. The chart looks very clear. You can take a short position with a tight stop-loss (SL).
