Inj/Usdt Breakout (INJ) has recently broken out of its trendline resistance, confirming the breakout. Currently, the price is retesting the breakout level. If the breakout is successful, a 25-40% bullish move can be expected. Please note that this is not financial advice, and it is recommended to do your own research (DYOR) before making any decisions.
INJUSDT trade ideas

INJUSDT.PHello Trader BINANCE:INJUSDT.P
possible falling wedge, because the ABCD area has been formed and also the strong support is valid for bullish return/rebound in the 18,760 area.
but for now the position is in the middle so take it or left to take this chart.
Note : not recommended for futures
Please add a comment and Positive feedback and constructive criticism are important to authors and the community.
Disclamer: Not Financial Advice

INJ/USDT BreakoutThe INJ/USDT chart shows a bullish trend following a breakout from a symmetrical triangle pattern in mid-2024. The price target of $50 was reached in Mid-June, followed by a successful retest of the breakout level as support. Increased trading volume during these periods reinforces the bullish momentum. While the chart suggests a potential continuation of the uptrend, caution and risk management are advised.
DYOR. Not financial advice.

INJUSDT in 1h time frameNice head and shoulders ?! I think inj can drop to 20 $ if head and shoulders approve

smart money concept analysissmart money concept analysis: Don't get caught in whale traps. What do you think of this idea? What is your opinion? Share it in the comments📄🖌 If you like the idea, please give it a like. This is the best "Thank you!" for the author

INJUSDT Hello friends, today you can review the technical analysis idea on a 1D linear scale chart for INJUSDT
TARGET
6.20
STOPLOSS
4.30

INJUSDT Long Trade SetupCurrent Situation:
Price Level: INJUSDT is currently in a range that provides a favorable entry point for a long spot position.
Trade Strategy:
Entry Point: Enter a long spot position between $25.50 and $26.00.
Take Profit Targets:
First Target: $30.00 - $32.00
Second Target: $39.00 - $41.50
Third Target: $49.00 - $53.00
Stop Loss: Set just below $22.50 to manage risk.
Summary:
INJUSDT is presenting a solid opportunity for a long trade within the $25.50 to $26.00 range. Set your take profit targets at $30.00 - $32.00, $39.00 - $41.50, and $49.00 - $53.00. A stop loss just below $22.50 will help protect against downside risk.

INJ/USDT 175% Potential Rally ahead!🚀 INJ/USDT Technical Analysis by Cryptorphic 🚀
- Price at Time of Analysis: $26.111
- Key Support Level: $25.451
- Resistance Levels:
- Short-term: $29.069
- Major: $30.512
- Long-term target: $69.785 - $70.007
🔹 Chart Patterns:
- A breakout from the descending wedge pattern.
- Potential bullish movement towards the long-term target indicated in the green zone.
🔸 Moving Averages:
- The price is currently below the 100-day moving average (purple line), suggesting a potential bullish trend continuation if it breaks the level in the coming days. This scenario is highly likely.
📈 Forecast:
- Expecting a price surge towards the $70 range, as depicted in the chart.
- Watch for price action around the major resistance levels for confirmation.
Do hit the like button if you like it and share your views in the comment section.
Thank you
#PEACE

INJ is ready for mainstream adoption.Hey! its Dalin.
Just dropping in to share a chart on INJ.
This cycle reminds me of Amazon as it was starting to breakout.
Later amazon became a household name, I think INJ could do this on a smaller scale.
I am keeping my eyes on this one.
And soon my wallet.
- Dalin Anderson

INJ Ready For A Move Back Up?Crypto markets have had some time to cool off and most assets have formed what is HOPEFULLY reaccumulation ranges.
This is a daily chart for INJ. Price has pulled back to the macro trend line, broken structure to the upside, pulled back 50% and appears to be finding support following the momentum curve.
Potential Targets:
An ABC mearsured move target aligns perfectly with the golden pocket and value area low for a 25-30% increase.
There is also a reverse head and shoulders style range forming with a target of the value area high. Nice and proportional. Looks ready or awfully close if continuation is in the future.
Invalidation will be a brake and rejection off the trend line.
Trade Well....
Your Friend,
Degen

INJ in 2D CUMULATE and 4h Adam and EVE accumulation pattern When looking for potential laggard plays I like to try and find patterns of accumulation or distribution
INJ :
In accumulation, I often look for an equilibrium pattern that happened after a big move on whatever timeframe makes the most sense and has the most clarity!
In this case, we are on the two day timeframe.
I look for a stop hunt of that range EQ low in that case. this is circled in my chart that a large fund or larger trader needs to find liquidity and the liquidity is always inside the retail stops.
This is what makes trading hard, because as a beginner, you learn to have your stops at these levels.
Often in equilibrium patterns, this can be a valid strategy.
But we're looking for accumulation or distribution you want to see that stop hunt.
And you can see that on the two daytime frame
Then if you look at the four hour now after a back test of this entire range from April and May, it is starting to show another type of accumulation pattern, so-called Adam and Eve pattern.
If you can catch the lows of a pattern like this off of the four hour timeframe, you have a tighter stop with less risk and potentially you catch the weekly or the monthly higher low.

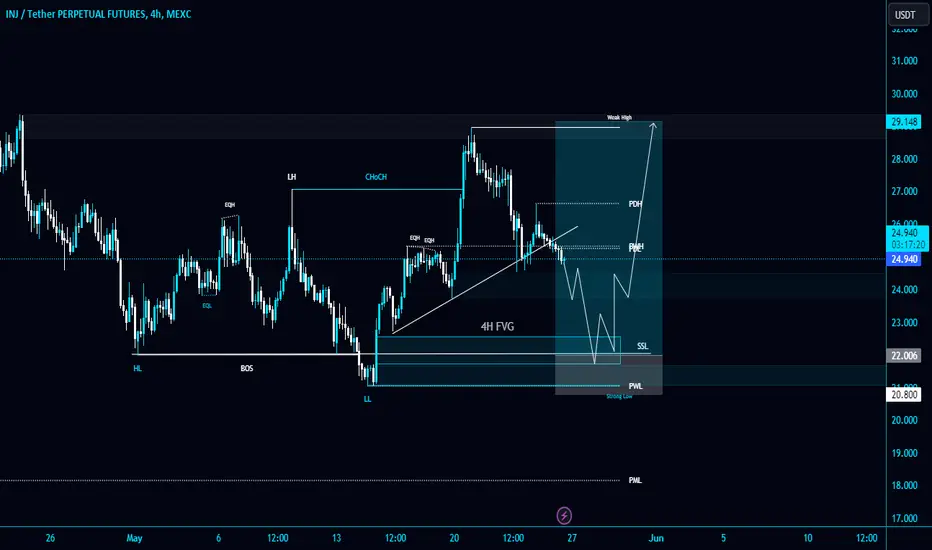
Keeping an eye on #INJ/USDT $22 level in 4-Hour TF!Keeping an eye on #INJ/USDT $22 level in 4-Hour TF!
There is a 4-Hour FVG gap, and the SSL liquidations hunt is already done. CRYPTOCAP:INJ will pumped from there. Placing limit order there.
Waiting for INJ to give long entry.These are the scenarios for INJ to playout.
●I will be looking for long Setup once INJ took 24.508$ and 23.711 SSL.
●Or reclaim (23 May daily FVG) so I can look for long Setup.
These are the 2 scenarios I'm waiting for.
In either scenario I will long INJ.
Follow and like for more analysis

INJ - strong looking coinINJ looks strong as hell but I am going to take 25% out here as we still can't flip this 24 Q1VAH level on BTC and there is nothing wrong with taking profits 😉
If BTC flips this level we should pump hard but as far as as we didn't there is a chance for a sell off.

#INJ/USDT#INJ
The price is moving in a bearish channel pattern on a 24-hour frame, and it adheres to it well and is expected to break it upward
The price rebounded well from the lower border of the channel at the green support level of 22.00
We have a tendency to stabilize above the Moving Average 100
We have oversold resistance on the RSI indicator to support the rise, with a downtrend about to break higher
Entry price is 23.70
The first target is 25.80
The second goal is 27.00
Third goal 29.30

INJ Trade Analysis: Bullish Outlook 📈Current Market Context:
INJ is breaking out of a downtrend and demonstrating bullish momentum. The recent transition to a deflationary model adds a strong fundamental case for long-term holding.
Trade Strategy:
Entry: Initiate a trade at the current market range of $25 - $26. This entry point leverages the ongoing bullish breakout.
Take Profit: Set multiple take profit targets to lock in gains at different stages:
First Target: $29
Second Target: $35
Third Target: $45
Stop Loss: Place the stop loss at $23.17 to manage risk and protect against potential downturns.
Rationale:
Fundamentals: The deflationary model and strong metrics support a positive long-term outlook.
Technical Analysis: The break of the downtrend indicates a potential shift to a bullish phase, supported by lower time frame (LTF) analysis.


$INJ Long term tradeMy next trade idea for $INJ. Bounce at the 200MA (demand zone), strong community, still currently in accumulation. If lower low made, idea is invalid.
Clearly descending wedge seen on the daily chart, this is typically a predictable structure that will play out to the upside.
Given the fact bitcoin has left its slump, I have conviction this will play out successfully.

INJ +100% in spot.So, #INJ has dropped by more than 50% from its recent local high of around $53. On the chart, there is a clear trend line that the price is responding well to. Additionally, we have Fibonacci support at the 0.236 level.
I am considering entering a position from the current values both in spot and futures. For myself, I have chosen to use credit leverage with a multiplier of x2, as in previous ideas.
Target - $50
Stop Loss - $17.5
This is not financial advice; everything you do, you do at your own risk!

INJ Injective takes a breather?
It has run nicely since the lows with incredible strength. But surely a correction will be necessary at some point.
Here we have some fib confluences in the area as well as bearish divergences. Similarity to the previous occurance might lead to 40-50% correction before resuming uptrend.
Surely not adivice to short here. Rather buy if hits zone in given time period
---
If you like my content, if it helps you gain profit, give it a like!
Thanks!
---
Hold my beer pls
----
No financial advice, do your own research, don't be stupid

InjectiveExponential charts can be a bit hard to trade
80% to the local highs here, you'd have to understand the pivot from dexperp to l1 here to understand why its marked up so heavily... id say were into aths by the end of the year though... 80$ target from the local highs so 4xish if we get the predicted post halving bullwave

INJUSDTA falling wedge is a technical chart pattern formed by drawing two converging trendlines that slope downward. It is characterized by decreasing price highs and decreasing price lows, with the upper trendline having a steeper slope than the lower trendline. This pattern typically signals a bullish reversal after a downtrend, as it suggests that selling pressure is weakening and the market may be preparing for an upward move. Traders often look for a breakout above the upper trendline as a signal to enter long positions, with stop-loss orders placed below the lower trendline. As with any technical pattern, it's important to consider other indicators and factors before making trading decisions.

INJ UPDATEFirst of all, You can see our previous analysis of inj in the "Related Ideas" section
A good demand area is now ahead of the price. We are looking for buy/long positions in this area.
We have marked this area with green color.
The targets are clear on the chart.
Closing a daily candle below the invalidation level will violate the analysis.
For risk management, please don't forget stop loss and capital management
When we reach the first target, save some profit and then change the stop to entry
Comment if you have any questions
Thank You
