INJ pullback soon INJ over 900% without corrections. I think soon we will see health pullback BINANCE:INJUSDT
Possible Targets and explanation idea
➡️Market Mood indicator we are at Sep 2021 level sentiment. Late longs will be liquidated
➡️0.5 - 0.62 lvls fib can be a fix profit zone before correction
➡️Inside this zone we got liquidity stop losses from September 2021
➡️Based Money power indicator whales start take a profit
➡️Healthy correction can be even to 5-6$ My previous idea 2.5 Monthly fvg probably invalidated for this current moment but will be like a main zone for next bear market
Hope you enjoyed the content I created, You can support with your likes and comments this idea so more people can watch!
✅Disclaimer: Please be aware of the risks involved in trading. This idea was made for educational purposes only not for financial Investment Purposes.
---
• Look at my ideas about interesting altcoins in the related section down below ↓
• For more ideas please hit "Like" and "Follow"!
INJUSDT trade ideas

INJ/USDT Gearing up for a Bullish Momentum Again? 👀INJ Analysis💎Heads up, Paradisers! #INJUSDT is on the brink of a bullish turnaround from a crucial support level at $30.12. If CRYPTOCAP:INJ maintains its momentum here, there's a high chance for a bullish journey, given the price's historical reverence for this support, marking it as a stronghold after respecting it three times.
💎However, if the upward trajectory of #INJ falters and dips below $30.12, we'll turn our attention to a lower demand zone at $16.62, where ample liquidity promises a potential rebound.
💎Vigilance is paramount: a breach below this secondary support could spell further declines as market sentiment leans toward a sell-off. Stay alert, traders, as we navigate the shifting currents of the #Injective market.

INJUSDT short POTENTIALOf cause crypto market is bullish and INJ is still looking good for long but not at current point in the way i see the market!!!
Idea will be valid for me till daily low taken out. I would like to see another push back into original consolidation to look into position on LTF.
I dont set targets for me here first of all because i will be managing position according to my trading strategy and secondly there was no entry for me :)))

Inj/usdt#INJ
update on 1D
Look at the this analiz
Inj first go to big support then step go to the 106$

inj on sk systembullish inj on sk-system with target 74-83$
based on fibonacci higher low and higher high

risky entry point 15M timeframei think its a risky entry point. the price could bounce up. 4% with 2x Leverage
do your own research. its risky i 15M time frame

buy signalhello
as you see in indicator bellow that i believe +70% of times works.
so as i mentioned in 1D chart the price is going up.
i see the indicator showed overbought in 4D chart that i marked with a box then the price went down. so the indicator bounced back with green bars so i will buy to top of the indicator.
i see the price at 51.6 zone. 20% from 45.5 easily with 2x leverage


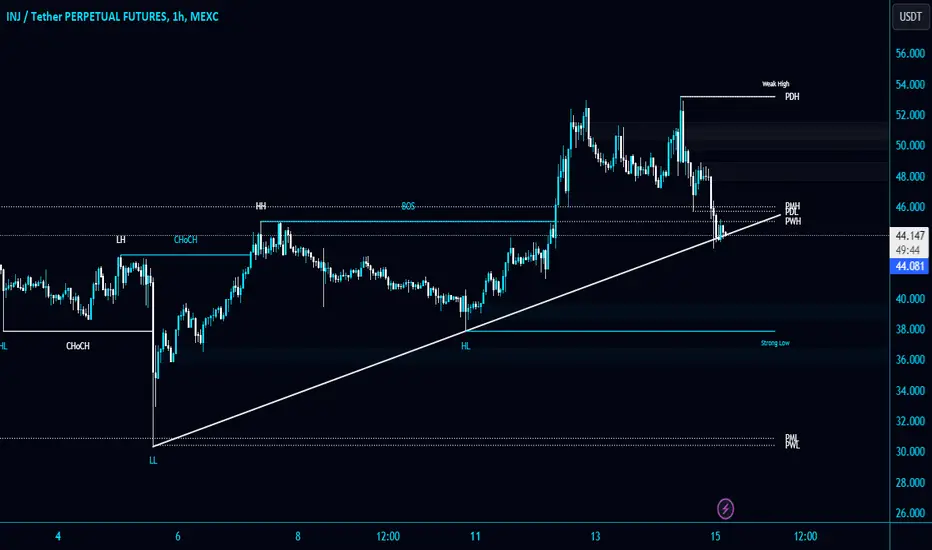
#INJ/USDT is testing the Diagonal Trendline in 1-Hour TF!#INJ/USDT is testing the Diagonal Trendline in 1-Hour TF!
CRYPTOCAP:INJ breaks the PWH $45 support level and looks heavy to me. #INJUSDT is looking good for short.
Wait for Trendline breakdown and retest to short it.
inj inteligentassetBullish scenario
Resistances 52.7 pivot high,64 Fibonacci extension
Bearish scenario
Supports 42.1 upper limit channel, 39 in 50 ema, 29.4 pivot low & horizontal,
27.15 in 200 ema

INJ may aiming for higher.INJ has been broken out from its consolidation range. The price action above consolidation range suggested that it may aiming for higher target, 95.

Would a cup and handle pattern appear on INJ/USDT chart?If a cup and handle pattern gets formed on INJ/USDT chart, we will have a good chance to long.
I am not saying the pattern will appear, just saying if it appears, we will have one position entry point.

INJ USDT for 200%Hello traders, my idea for INJ is that if the price can stay above Bridge W, the price will likely go up 61-100% of M1 and it might take 1-2 months if bitcoin is still bullish. The price target we set. It's not difficult.
TP1 60
TP2 71
TP3 90

INJ Time Coming 👉 It’s Almost Three Months That INJ Price Playing At The 45$ to 30$ Range At This Horizontal Channel But I Think It’s Time To Breakout
📥 I Expect a The Price Break The 45K Resistance Level By Strong Green Candle Toward a 55$ And 70$ As a Next Targets Soon

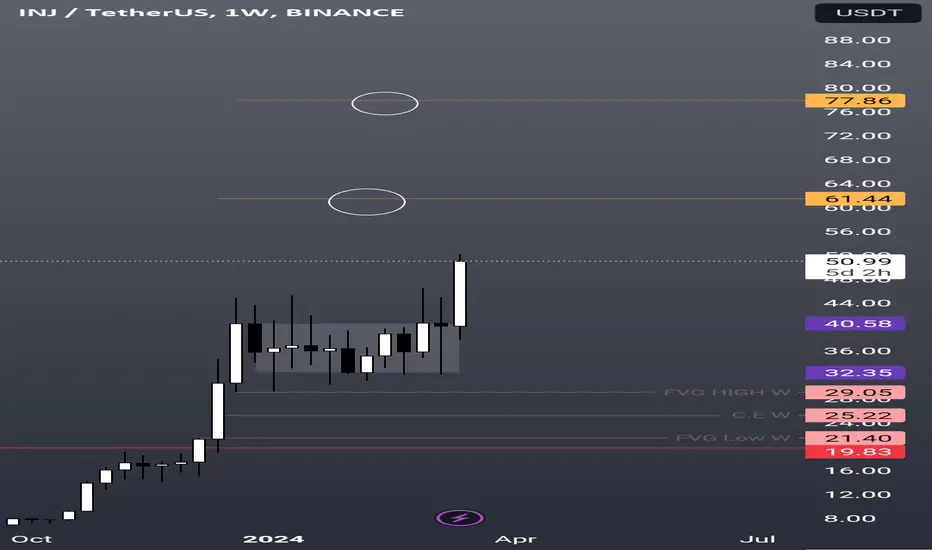
INJ New All Time High (Injective)This remains one of my largest holdings, and one that I have been sharing since the bottom. I have traded around my core position.
As you can see, after months of consolidating, INJ has broken out for a new all time high. This means that it is once again in a blue sky breakout. It may not come back for a retest, but conservative traders like to buy the previous highs as support in a situation like this. This is the area from around $44 to around $46.50.

First profit take INJI have decided to sell all of my staking rewards from the past year, I am also unstaking 25% of my position as the market fires up. I just feel like we are way overextended here and I am extremely up on my position. I plan on keeping this as stables on Osmosis. If the market crashes I think inj returns to 40ish.

Triple Digits IncomingINJ putting in a textbook 10 week base with a very similar shakeout to December. Given how long the base is and the craziness in other parts of the market, I think we head over $100

INJ going for 200$INJ finally flying.
●For long period of time INJ was in accumulation zone.
●Break out of accumulation zone is down/ now we are in expansion zone for INJ.
●BUY the dip you see market coming down....might get a change to buy.
Like and Follow for more analysis
INJ BREAKOUT TO $70 Clean breakout of range
Lots of development coming to Injective Chain
Easy momentum ride up

Here I buy Injective Protocol at $50Here I buy Injective Protocol at $50
It's written in the stars already.
there's no use running if you're on the wrong road. I always run on the right roads while they're lost running on the wrong roads all the time.
They pass up something that’s attractive today just because they think they will find something better tomorrow.
That's the case with Injective here. It's very attractive at $50 still
That's why I'm still buying it here while you'll get left behind wait for this one to dip as well given the fact it'll only stop at 3 digits now.
I became a XRP bag holder yesterday and now I'm buying INJECTIVE PROTOCOL.
You know, I'm becoming bag holder of many lately and when I become a bag holder of something it's just a matter of time for the big pump to come. And not too long, cause I don't like to be bag holder for too long without profit
See you up there

INJ new bullish patternINJ / USDT
So far one of strongest coins in this bull cycle
INJ is still forming HH and HL and printed ascending triangle
In short term above ted resistance is strong bullish
Best of wishes

INJ Trade IdeaWe called this trade in our VIP channel, all targets achieved and now we hold a moonbag.
Injective Ecosystem extremely strong horse in the bear market, was undoubtedly going to be a front running horse in the bull market.
Winner winner Injective Dinner!

INJ has bullish signs!
🎗#INJ/USDT 🎗
LONG
Leverage: (10.0X)
Entry Targets:
1) 48.33
2) 46.76
Take Profit Targets:
1) 50.87
2) 52.97
3) 54.80
4) 56.73
5) 58.72
6) 60.71
7) 62.53
8) 64.46
Stop Targets:
1) 37.46
🟡Chart is speaking it self!
_ _ _ _ _ _ _ _ _ _ _ _ _ _ _ _ _ _ _ _ _ _ _ _ _ _ _ _ _ _ _ _ _
Thank you for seeing idea .
Have a nice day and Good luck
🔴This is only an idea and not a financial advise ( NFA )🔴
