INJ Your Opportunity to Build Wealth: Unlock Crypto's**Short Fundamental Analysis for INJ Coin**
**INJ Coin Overview**
INJ Coin is the native token of the Injective Protocol, a decentralized finance (DeFi) platform that enables users to trade and exchange digital assets across different blockchains. The INJ token serves a variety of purposes within the Injective Protocol, including:
* **Paying transaction fees:** INJ is used to pay for transaction fees on the Injective Protocol.
* **Staking:** INJ can be staked to earn rewards and participate in governance.
* **Voting on protocol proposals:** INJ holders can vote on proposed changes to the Injective Protocol.
**INJ Coin Fundamentals**
The Injective Protocol is a promising DeFi platform with a number of key strengths:
* **Cross-chain trading:** The Injective Protocol allows users to trade digital assets across different blockchains, which can provide greater liquidity and market access.
* **High throughput:** The Injective Protocol uses a Layer-2 scaling solution to achieve high throughput and low transaction fees.
* **Governance:** INJ holders have a say in the direction of the Injective Protocol through a decentralized governance mechanism.
**INJ Coin Recent News**
In recent months, there has been a lot of positive news about the Injective Protocol and the INJ token:
* **Integration with major exchanges:** Injective has announced integrations with major cryptocurrency exchanges, such as Binance and Huobi. This will expose INJ to a wider audience and increase liquidity.
* **Protocol upgrades:** The Injective Protocol has been undergoing a series of upgrades, which are aimed at improving performance and scalability.
* **Growing community:** The Injective community is growing rapidly, with a number of active developers and community members.
**Overall Outlook for INJ Coin**
The future of INJ Coin looks bright. The Injective Protocol is solving a real problem in the DeFi space, and the INJ token is well-positioned to benefit from the protocol's growth. However, it is important to note that the cryptocurrency market is volatile, and there is always a risk of price fluctuations.
**Disclaimer**
This is not financial advice. Please do your own research before investing in any cryptocurrency.
**
INJUSDT trade ideas

INJ Alt Pump beta Is this the end of the Road or More upside
Fake out lower and ripped hard
Maybe a Friday dump is in play here are my Levels from TPO and bookmap
Vol goose eggs mostly filled except for $29

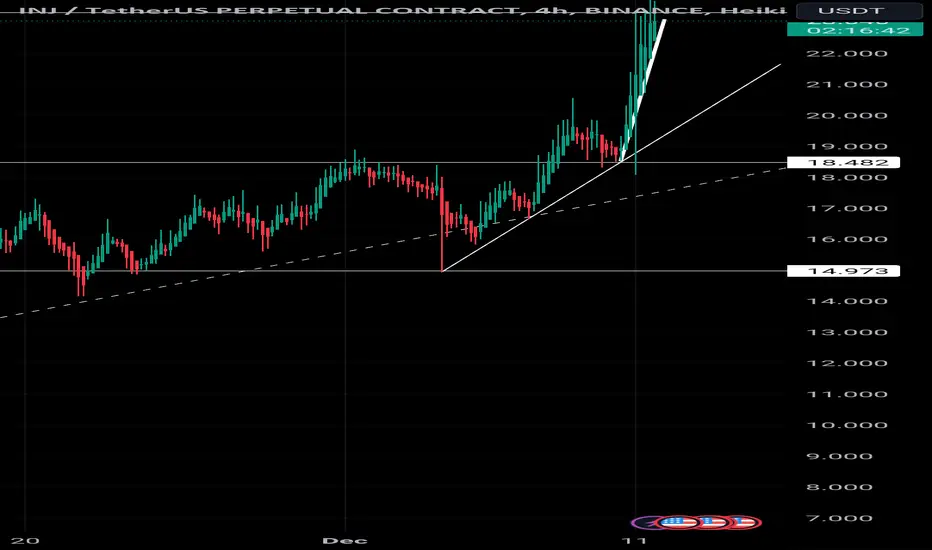
INJ Next Target Is 22$👉 The Price Successfully Breakout The Falling Wedge And Now Ready To Start a New Bull Rally
📥 Targets Are 18$ And 22$

INJUSDT 10X profit longtermINJ is on of the most hyped AI coin and has gained a lot of attention recently due to the spike in price. This is one of my longterm AI coin I will hold until December 2024. I am expecting 10X profit on this one

What is INJ ? Product descriptionInjective (INJ) is a blockchain protocol focused on decentralized finance (DeFi) applications. Developed by Injective Labs, it was launched in 2018 with key features designed to enhance the DeFi ecosystem.
Key Features of Injective:
- Interoperability: Built using the Cosmos SDK, Injective is highly interoperable. It supports the Cosmos Inter-Blockchain Communication (IBC) protocol, allowing seamless asset transfer across different blockchain networks. Injective is compatible with multiple blockchains like Ethereum, Solana, and Cosmos.
- Decentralized Finance Tools: Injective provides developers with software modules to build DeFi solutions, including decentralized exchanges (DEXs). These tools ensure interoperability and liquidity aggregation within its ecosystem.
- Decentralized Autonomous Organization (DAO): Governance of the Injective protocol is overseen by a DAO, allowing community-driven network and protocol updates.
- Resistance to Front-Running: Injective employs a frequent batch auction model to prevent front-running, a common issue in decentralized exchanges.
- Deflationary Tokenomics: INJ, the native token of Injective, has a deflationary mechanism. 60% of all protocol fees are burned weekly, reducing the token's supply over time.
- Use Cases of INJ Token: INJ is used for transaction fee discounts, staking rewards, governance, providing passive income, and incentivizing market makers.
Development and Ecosystem:
- Development Team: The Injective protocol was developed by Injective Labs, comprising engineers, traders, and operators. The team maintains a relayer interface and offers backend support for the protocol.
- Ecosystem Growth: Injective has a rapidly growing ecosystem with projects like Helix, Astroport, and Frontrunner. It also announced a $150M ecosystem initiative to support DeFi developers building on Injective.
- Technological Upgrades: Injective has undergone significant upgrades, such as the Injective CosmWasm Mainnet upgrade, which supports smart contracts and automated execution. The upcoming Volan upgrade will introduce sub-second block times and full IBC integration.
Injective Chain and Tokenomics:
- Chain Details. Injective Chain is a permissionless public blockchain network that operates on a Delegated Proof-of-Stake (DPoS) consensus.
- Token Supply: INJ has a maximum supply of 100 million tokens, with various allocations for ecosystem development, community growth, and initial sales.
In essence, Injective aims to create a more democratized and efficient financial system through its DeFi-focused blockchain infrastructure and native token INJ.

Does Inj plan to hit $40 ?🔍🌪️
The volume of trading in this currency is a strong indicator of buyer interest.📊👀
The Inj currency has seen significant growth in the past 60 days, rising by 250%. This growth is due to a number of factor

inj top look like CRYPTOCAP:INJ want to bleed lower. good r. lets see waht happens until proven otherwise

INJ/USDTInjective. One of the most hyped and profitable coin from this year.
At its all time high level. INJ was at this level back in 2021 April where BTC hit 69.000 dollars.
Just an interesting fact that while BTC is no where close to reach its previous level, INJ is doing something very surprising.
I will watch this level and provide an update on my opinion if it can close at least 2 weekly candles above 25 dollars.
Not a financial advice

Injective (INJ/USDT) New High !Unbelievable! Four months before Bitcoin Halving INJ has a New High !
....................................................................................................................
We are not registered or licensed in any jurisdiction whatsoever to provide investing advice or anything of an advisory or consultancy nature.
and are therefore are unqualified to give investment recommendations.
Always do your own research and consult with a licensed investment professional before investing.
This communication is never to be used as the basis of making investment decisions, and it is for entertainment purposes only.

Fundamental analysis of the Injective cryptocurrencyGiven the scores obtained from our fundamental analysis of the Injective cryptocurrency, the project shows significant potential as a cryptocurrency investment. It demonstrates robustness in several areas, particularly in social and media presence, ecosystem development, and partners and investors. However, it must address certain challenges, including bolstering its software developer team and enhancing token utility within its ecosystem, to further increase its investment appeal. Despite these areas of improvement, the risk associated with the Injective cryptocurrency seems to be outweighed by its potential. It represents a sound project in the burgeoning DeFi space, offering promising opportunities for investors who are prepared to navigate the typical risks associated with crypto investments.
SOCIAL & MASS MEDIA: Score 8.7 out of 10
AUDIT & SECURITY: Score 7.11 out of 10
TOKENOMICS: Score 7.45 out of 10
ECOSYSTEM DEVELOPMENT: Score 8.1 out of 10
TEAM & DEVELOPERS: Score 6.8 out of 10
PRODUCT & UTILITY: Score 7.9 out of 10
PARTNERS & INVESTORS: Score 8.85 out of 10
Overall Score 7.90

INJUSD Bullish long term idea INJ has emerged as a standout performer this year, currently consolidating above a resistance level at $16. I have held a position since it was under $10 and have recently added to it. My expectation is for INJ to reach and potentially get rejected at the previous bull market's all-time high (ATH) of $25 USD. If this scenario unfolds, it could set the stage for a significant surge, possibly exceeding $100.
Also the recent surge in Bitcoin (BTC) prices, there's a possibility that a significant portion of the capital could flow back into altcoins which will be postive for INJ

20$ INJ IS COMING SOON!Remember that it is never too late to buy and the market always gives you another chance to do so, maybe the second time will be less profitable , but it will definitely have less risk and loss .
For this currency BINANCE:INJUSDT , we are waiting for our second chance and then we will buy for higher targets.
Buying range
$9-10.5
Possible targets
$16
$20
$25
and less likely targets
$40
$65

INJ/USDTCRYPTOCAP:INJ formed an ascending broadening wedge pattern which broke down, and we have now formed a descending channel, which is a bullish reversal pattern, a breakout out of it can pump to first target of $20

INJ/USDTEverything I see is in the charts,
so we have had a nice break, we have been here making a nice support for ourselves.
Once we break free again, 1st target is 24 dollars.
2nd target is ATH.
Then: who knows. HIGH.

INJ/USDT Ending Diagonal
so many discussion on INJ price , one of biggest run among most competitors currently trading 19$ , in simple term of full cycle mostly down just fifth wave remian which we are in at time of speaking 4 out of 5 impusle wave completed waiting for final touch around 20-21$ to complete full cycle , before start going down as well taking and going to liquidity area to take out all short position and stop loss orders .
this setup will be cancel if we see any extension of fifth wave ,as of now clearly can see ending diagonal pattern of fifth wave .

INJ all time highs this yearINJ really is defying this BTC dump. The cosmos ecosystem has some of the craziest bulls Ive seen in any market. Regardless this token does a way better job at providing the value of the cosmos than Atom does. I think we just might see that all-time-high in less than 10 days.

"INJ"The NEXT SOL of the cryptocurrency This is a coin you must not ignore for next BULL Run.
Maybe, it will bullish like, SOL did in last BULL Run.
INJ INJECTIVE EW COUNT with targetsINJective Protocol
had massive rally, reached target zone for wave 4 retracement levels of 0.236-0.382.
Can it go much higher? Possible but less favorable.
Fib Extension targets were also hit on both calculations, so its best to favor upside as limited.
Wave 4 * can * retrace to a maximum of 0.5 fib before the count can be considered as invalid.
For now, we're keeping the count as is until markets show us the count is invalid.
Favoring current high as wave (iii) of wave (iii) in a large degree ABC corrective rally.
Suspecting volatility on both sides similar to Feb with a move lower into a move higher before a larger pullback into a final pump higher to complete the wave (v) of wave C (projection NOT absolutes). However it can also be viewed as completed since it retraced to the targets as mentioned. Its not a long entry, but will be looking to short it once market gives a more clear view and entry. Will keep the count updated and post it when candles print. The key areas to look for are mentioned and the idea we're looking for has been explained, so if you can make sense of it keep an eye on the prize.
We will have to see how it plays out. A large pullback can be a great opportunity to scalp some profits; a retest of the highs should be coming soon enough.
We will patiently await to see what the markets decide over next few days/weeks going into the month of "sell in May, then go away"
If you like my charts, please feel free to share, comment and click like to show support.
Thanks and happy trading,
Cheers

INJUSDT on the riseThe move on this one has been pretty impressive. The price blasted through the monthly resistance MR1 on this move up and reached its all time high value. I believe it has a lot of potential to go further up. One should look for a good entry on this one for high time frame trade. Weekly support WS1 can be a good entry point in case we get that. For smaller time frame trades, we will discuss that in a separate post.

INJECTIVE Showing STRENGTH - Almost All Time HighInjective has continued to show incredible strength, even when Bitcoin corrects. As you can see, price is roughly 10% off of the ALL TIME HIGH, when most altcoins are still down 80-90% from their peaks.
A break above $25.306 would be a blue sky breakout in search of new all time high, one of the best trades their is. We want to see a close above that level.
Other key levels shown on the weekly.

Injective INJ price is preparing to be first to surprise everyonWhile most altcoins are still thinking about whether or not to repeat the growth in the BTCUSDT price, INJ buyers have already answered this question.
The INJUSDT price has broken up of the corrective bullish flag, and consolidating above it, and is starting a new wave of growth.
In our opinion, "the round figure" $20 is an excellent medium-term target for the growth of the Injective token price
_____________________
Did you like our analysis? Leave a comment, like, and follow to get more

injThere is an important resistance here that you can see in the weekly. There is also a small support in the green box. If there is support there, let it rise again and then enter the trade according to the market conditions.
If the green box breaks, your next targets can be green lines

INJ Long + Starting a new challengeI'm starting a new challenge on a 2nd Bybit account. 2 000$ to 2 000 000$
And I will try to post one chart every days to discipline myself.
Starting with today's idea on INJ USDT:
Bought INJ at 19$ will sell to 19.30$.
No stop loss, I will just hold.
Wallet : 2000$ to 2583$ today.
