injIt has grown very well, if it wants to improve, it can be three green lines in the first step and then a green box. The important point is that it can break two red lines to continue moving.
INJUSDT trade ideas

INJUSDT bearish divergence ,time for retraceThe INJ/USDT pairing has exhibited a bearish divergence on the 4-hour chart, indicating a potential retracement following an extended upward trend. The black lines represent the support levels that are anticipated to be tested as the price is expected to decline to these points.


800% profit on long positionHello
800% profit on long position is in access. I propose spot position.


Buy is preferable in this regardsCurrently, the price is on the way, Wait till the unmitigated OB or the demand zone,
REMEMBER: The price is on a buy trend in the bigger picture, Take Care...

#INJ/USDT is holding Trendline as a support in 4-Hour TF!#INJ/USDT is holding Trendline as a support in 4-Hour TF!
CRYPTOCAP:INJ needs to clear the PDH $18.12 to gain the bullish momentum. In case of trendline breakdown, we can short it.

#INJ#INJ
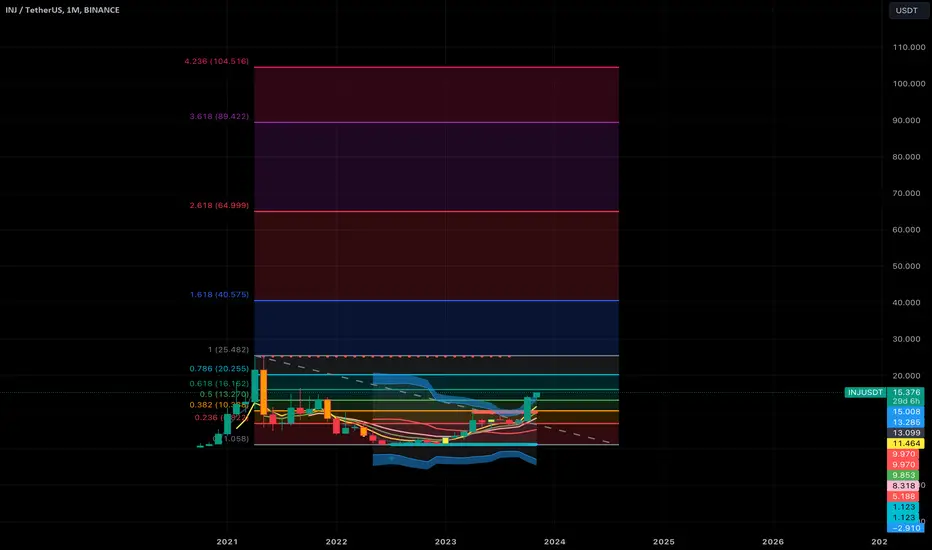
According to HTF chart (M, 6M) I highlighted important support level, for continuation of the uptrend until 21.53$, at around 14.4 - 13.4$
As long as the coin above it, there is the chance to go higher and make a new ATH (1.)
Breaking below “monthly support” level, or 13.415$ will drop the coin until 10 - 9$, where the coin may find the support (2.)
Currently, important to look at Weekly close. I think there will be correction until 14.4 - 13.4$ on Lower Time Frames.
If the coin manages to close with the D candle above resistance or 16.764$, in this case it will continue its uptrend without correction until 20 - 21.53$

Long trade setup for INJUSDTFor the BINANCE:INJUSDT.P Long Trade Setup, the following values are suitable for our interval trade:
Entry: 16.780
Target: 17.405
Stop: 16.194
Cost Reduction: -
The profit is reasonable relative to the risk.

INJ/USD Short setupGood morning to all Folks out there!
It has been a great week for Alt-coins so far and I am hopeful a-lot of you would have made good gains so far.
For anyone doubting the gains, I already spoke about Alt-coins rally in my previous idea and was pretty bullish on Alt-coins with BTCDOM getting rejected on a Major level.
INJ or Inject have been a gainer and have gained more than a 100% in the past few days.
I was expecting the move towards upside, However as it approaches this important level and faces resistance, I believe INJ is headed for a correction back to the support zones marked in the chart.
Trade Idea:
INJ/USD = Short
Entry point: CMP
TP1: 15.5
TP2: 13.8
TP3: 13.4
SL:17.8
Please do like and follow if you find the content helpful, Thanks.

Inj/usdt Don't Be So BullishGet ready for an exhilarating adventure in the crypto world! 🤑 I'm expecting INJ/USDT to soar to $18, or it might even aim for the stars at $1,850! 🚀🌕
But, here's the twist: After that exciting climb, there's a chance INJ/USDT might take a breather and come back down to $15. 😓
Always remember, investing in crypto is an adventure. Keep your eyes wide open 👀 and do thorough research 📚 before making any financial decisions. This isn't financial advice, but it's your compass in the crypto jungle! 🌴💰
Happy trading, brave crypto explorers! 📈💎"

Reversal Pattern, Double Top might be appearedOn week chart,
Very impressed for Injective recently with nearly 1,500% from $1,1 now BINANCE:INJUSDT is trading at $17,22x
Injective has ATH around $25 this level is Resistance for this bullish. Besides, some signals for reversing such as
- ADX is moving up to 60
- RSI overbought and can be divergence for next HH
- Volume is weaken
Time will tell

INJ/USDTthe funny thing is, if CRYPTOCAP:INJ gets rejected at ATH its actually a good thing because it is highly likely that it will form a cup and handle pattern, and can explode to $50 levels easy then


INJUSDT LongINJ Showing movements towards a possible 5th wave up to the 2.618 miner Fib extension for a Long scalp on the lower and mid time frames holding a nice 15m pitchfork channel with lower channel break on S/R flip forming support between 17.110 - 16.876

Here I buy Injective Protocol at $17Here I'm buying Injective Protocol at $17 price level
The price is testing a resistance level at $17 so now I buy and the bullish breakout will start
and Injective Protocol will go up
From now it's time for Injective Protocol to shine.
See you up there.


Will INJ slide into local demand?INJ has been on fire lately and is still my largest crypto holding. The token has really become the value prop of the cosmos ecosystem as my original thesis was predicting. The token has doubled in value in less than a month and should correct heavily at some point. There is clear bearish divergence with rising price and falling RSI. It would make sense for the token to fall to 12ish dollars here but I dont like to short powerhouses like this. I will keep my long-term spot staked.

INJ TRY RNN bearish divergence and one possibility.
This is just from what I see on divergences and my script :)
There will be some sell action below structure if this works out.

INJ tends to riseFrom where I entered "START" on the chart, the INJ climbing structure has started. The structure is a diametrical (or symmetrical). On our chart, there is a large liquidity pool, which I have shown with the symbol $$$.
If we have a diametrical (diametric corrective branches are 7), there will be only one G wave, which by removing the liquidity pool and hitting the specified supply, the upward structure can be finished and inj will enter the corrective phase.
This is just an idea and you should do the necessary checks to get a position and then enter the position with capital management and stop setting.
For risk management, please don't forget stop loss and capital management
Comment if you have any questions
Thank You

INJ / USDTWe see a clear upward trend, with the completion of the market structure, it is preferable to search for buying opportunities, Commit to financial management and we will update later if necessary

$INJ ANALYSIS FOLLOWING ELLIOTT WAVE THEORYCRYPTOCAP:INJ has a huge pump right now. this is the fifth wave of CRYPTOCAP:INJ in the Elliott wave theory. Additionally, #RSI is in the overbought regions and volume is decreasing gradually. Therefore CRYPTOCAP:INJ will have a correction in the near future.

INJ - Back to ATH and heading to $40Injective is breaking all resistance levels and is straight going back to it’s all time high of $25. From there the price can to up to Fib. 1.618 $40.