INJ long to $13.6INJ Long
Target: $13.6...will aim to secure 85% tp there
Stop: $11.82 or lower
3RR+
Entry is a bit aggressive but so is this market, gotta adapt. It might wick down a bit before take off but am going bed now so won't be able to wait around, stop should be wide enough.
INJUSDT trade ideas

Injective Bullish Reversal Signals —Technical Analysis WorksThe reversal signals show up in so many ways. Some can be predicted with the candles, for example, here the bottom session produced a high volume Doji, a clear reversal signal. The action that followed this Doji confirmed this signal.
There was a low first in February, the session ended with high volume and green.
There was a lower low in March (left shoulder), the action ended with relatively high volume and green. The bullish signal comes from the fact that bearish volume is dropping, not present.
The final low came in 7-April (head) and this session also ended green with high volume. The bottom is in.
The action later went on to produce an inverted Head & Shoulder pattern, another reversal signal fully confirmed.
After a small retrace, we will see additional growth.
These candles, these indicators, these signals and patterns help us predict where the market is headed next.
Short-term, as in days or maximum a week or two, anything goes. There can be a small drop or whatever, long-term, it is going up. Based on the signals coming from this chart.
Knowing this, we can buy, we can hold and we can trade.
It is not easy, but everybody can learn this craft if they have what it takes.
Not everybody can be a professional football player, not everybody can do acrobatics on a motorbike, but it can be done by anybody who puts enough time, heart and effort in knowing how to get it done.
The "intelligent investor" is for those that have no time or simply don't want to learn how the market works. It is ok, it is a tool and can be used successfully, but does not mean that timing the market is impossible, it simply means that most people can't or choose not to do so.
Now, tell me again about your random walk.
Namaste.

Injective | INJ & AvalonThe price of Injective 8 dollar today with a 24hour trading volume of 69 million dollar. This represents a 13% price increase in the last 24 hours and a 29% price increase in the past 7 days. With a circulating supply of 80 Million INJ, Injective is valued at a market cap of 640 million dollar.
Injective is a blockchain built for finance. It is an open, interoperable layer1 blockchain powering next gen DeFi applications, including decentralized spot and derivatives exchanges, prediction markets, lending protocols..
Injective is upgrading its Avalon mainnet with overwhelming community support. The upgrade aims to enhance L1 scalability, achieve sub-second block generation time, and implement PoS delegation transformation.the upgrade will optimize transaction processing speed, network efficiency, and security within the Injective ecosystem
Inj price is up 400% since we posted the first analysis on January and it tries to recover as fast as possible. most indicators sending a buy signal and the volume looks strong too

INJ/USDT Breakout Analysis – Bullish Momentum Building!
🔸 Key Support Zone at $6.5 - $9:
INJ successfully bounced from the key accumulation zone, hitting a low of $6.5 and is now showing strong signs of a breakout, currently trading at $11.85.
🔸 Retest Opportunity at $10.00:
If you missed the entry in the accumulation zone, a healthy pullback and retest near $10.00 would offer a great re-entry with reduced risk.
🔸 Upside Target: $50+
The breakout opens up targets towards $20, $30, and eventually $50+ if momentum continues and BTC dominance remains favorable.
🔸 Risk Level at $9.00:
Bullish structure remains valid as long as price stays above $9. A break below this could lead to consolidation or invalidation of the breakout.
🔸 Action Plan:
Entry on retest: $10 - $10.50
Invalidation below: $9
Targets:
✅ TP1: $18
✅ TP2: $28
✅ TP3: $38
✅ TP4: $50+
INJ appears to be entering a new bullish phase after a long consolidation. Keep an eye on volume spikes and market sentiment.

INJUSDT - Monthly chart telling everything!A nice bounce occurred as soon as it touched the legendary support — the primary trendline and the grey zone.
Just look at the price behavior every time it approaches this rectangle.
You'll notice that, based on the Elliott Wave Impulse, Wave 4 has likely completed, and we’re now entering the final impulsive leg — "Wave 5"
$100 is a very modest target in the long term.
Best regards Ceciliones 🎯

#INJ/USDT#INJ
The price is moving within a descending channel on the 1-hour frame, adhering well to it, and is heading for a strong breakout and retest.
We are seeing a rebound from the lower boundary of the descending channel, which is support at 9.54.
We have a downtrend on the RSI indicator that is about to be broken and retested, supporting the upward trend.
We are looking for stability above the 100 moving average.
Entry price: 10.00
First target: 10.32
Second target: 10.64
Third target: 11.00

INJ - Long Trade Setup (Medium-Term Reversal Opportunity)INJ (Injective) has completed a deep liquidity sweep and is now reclaiming key technical levels, including the 21-day EMA and a critical horizontal support zone around $11. This sets the stage for a potential medium-term move higher if the structure confirms.
🔹 Entry Zone:
Around $11
🎯 Take Profit Targets:
🥇 $13 – $14
🥈 $17 – $18
🛑 Stop Loss:
Daily close below $8.50


INJ Head & shoulderBuy gradually from here or wait for breaking through this resistance line with a short-term target of at least 10%+.

INJ Breakdown in 1H | Bears in Control👀 Welcome to my Trading View Analysis and Trading Channel Here , we share the latest market analysis, trading signals, and key insights together .
Ready for smarter trades ? ⭐️
⚡️Today , we're going to analyze the INJ ( Injective) coin together on the daily timeframe and find triggers for our positions .
📉 INJ 1H Technical Breakdown
The INJ coin is currently exhibiting signs of weakness on the 1-hour timeframe, having broken below the key support level at $9.18 and continuing its downward trajectory. This movement indicates a shift in market sentiment towards bearishness.
Binance
🧭 Trend & Indicators:
Downtrend Formation: A clear downtrend is forming, characterized by lower lows and lower highs, suggesting sustained selling pressure.
Increasing Selling Volume: There's a noticeable increase in selling volume, reinforcing the bearish momentum.
Binance
RSI Approaching Oversold: The Relative Strength Index (RSI) is nearing the oversold zone, indicating potential for further downside but also cautioning traders of possible short-term reversals.
Price Below SMAs: The price is closing below all three Simple Moving Averages (SMAs), signaling a continuation of the bearish structure.
EMA 50 Rejection: A sharp rejection occurred after a retest of the EMA 50, followed by a strong red candle — a classic sign of bearish strength.
📰 Recent Developments:
Price Decline: Over the past week, INJ's price has declined by approximately 8.3%, reflecting broader market corrections.
CoinGecko
Market Activity: Despite the price drop, Injective's trading volume remains robust, indicating continued investor interest and market activity.
CoinCarp
+15
crypto.news
+15
Coinbase
+15
Technical Patterns: Analysts have observed that INJ has broken below the $10.25–$10.30 support zone, triggering a bearish continuation pattern.
Binance
📌 Trading Insight:
With proper risk management and a solid trading plan, this setup offers a potential short opportunity. The technical signals are aligned, and momentum appears to favor sellers for now.
🎯 Watch for continuation patterns or lower time frame triggers to enter with precision.
I love you all so much . 👀
don't forget about capital management and risk management .
Be careful with your positions . 🥇

Inj long to $9.655 today!I flipped bullish on #Injective
📈Just went long
🎯Target: $9.655
💸partial: $9.555
🛑$9.193 stop or lower
DTT applied.
#injusdt #inj

INJ short down to $8.833 areaLooking at he pa overall it seems INj market wants to dump the price lower down to $8.833 area.
Maybe it doesn't happen now fully but it probably will break down bearishly to start then correct a bit before continuing..or who knows.
I saw this a bit late. Would have liked a better entry with higher stop. Current stop is not that bad but it doesn't provide full invalidation. Anyone seeing this now - waiting for 15 minute tf to correct a bit or use wide stop best.

Inverse H&S on Inj Injective has been very strong for the past two weeks
Now it will form an Inverse Head And Shoulders
89% profit target

TradeCityPro | INJUSDT Ready for a Big Move?👋 Welcome to TradeCityPro Channel!
Let’s dive in and analyze one of the popular crypto projects, INJ, which has a high likelihood of movement, and check our entry triggers together.
🌐 Overview Bitcoin
Before starting the analysis, I want to remind you again that we moved the Bitcoin analysis section from the analysis section to a separate analysis at your request, so that we can discuss the status of Bitcoin in more detail every day and analyze its charts and dominances together.
This is the general analysis of Bitcoin dominance, which we promised you in the analysis to analyze separately and analyze it for you in longer time frames.
📊 Weekly Time Frame
On the weekly time frame, I see that the seventh period is stable, INJ, and compared to the majority of altcoins that have their own low price levels, it is in a better space and is engaged in its own supports!
After breaking the primary trend ceiling, namely 9.28, we experienced a sharp upward movement and formed a historical ceiling at $53, and after forming a distribution box and breaking the important floor of 16.20 and pulling back to it, we experienced a continued decline.
We have now reached support again, which was previously a very important resistance, and now, as a result, it is probably not lost, but the weekly candle is a very good and bearish candle! Don’t forget to save your profit, your strategy booklet, and your positions, otherwise, you will have made a 450% move without adding anything to your capital!
📉 Daily Time Frame
On the daily time frame, our trend is completely bearish as you can see, and the events are completely accompanied by the formation of a downward bottom and top, but we are likely to suffer for a while.
After getting rejected from 34.16 and forming a box between 20.16 and 25.93 and losing the bottom, it made a move and then while pulling back with low volume and the next conversion to red, it became an inverted Sharpe, we experienced a decline!
After breaking the daily trendline, which was also an important trendline, its trigger at 8.48 was broken, and we are currently engaged with the resistance at 10.47, and the next and most important trigger, so to speak, is after breaking 10.47, and you can even have a spot buy with this level!
🕓 4-Hour Timeframe
In the 4-hour time frame, we are also ranging between the box of 9.24 to 10.41, and practically, whichever side we break, we can say we can take its position and go along with it!
📈 For a long position, the trigger is completely clear, and after breaking 10.41, make sure to take a long position, and you can even open a position before this trigger breaks with the presence of momentum in lower time frames!
📉 For a short position, we have just formed the support at 9.24, and if we bounce from this support and hit a lower high, or better yet, get rejected before 10.41, we go for a short position and a break of 9.24!
✍️ Final Thoughts
Stay level headed, trade with precision, and let’s capitalize on the market’s top opportunities!
This is our analysis, not financial advice always do your own research.
What do you think? Share your ideas below and pass this along to friends! ❤️

INJUSDT Potential UpsidesHey Traders, in today's trading session we are monitoring INJUSDT for a buying opportunity around 9.50 zone, INJUSDT is trading in an uptrend and currently is in a correction phase in which it is approaching the trend at 9.50 support and resistance area.
Trade safe, Joe.

Inj scalp short to 9.5Just now opened a scalp short position on inj. Targetting 9.5 area. Just a quick trade. It might spike lower but being conservative

$INJ Breakout Alert!CRYPTOCAP:INJ breakout alert!
-It finally broke above the downtrend line after months of
consolidation.
-Retest and holding the key support zone around $8.50–
$9.00.
-Now, we are aiming for the next leg toward $26, a
Potential 184% move.
-Trend shift confirmed. Watch closely!🚀
DYRO, NFA

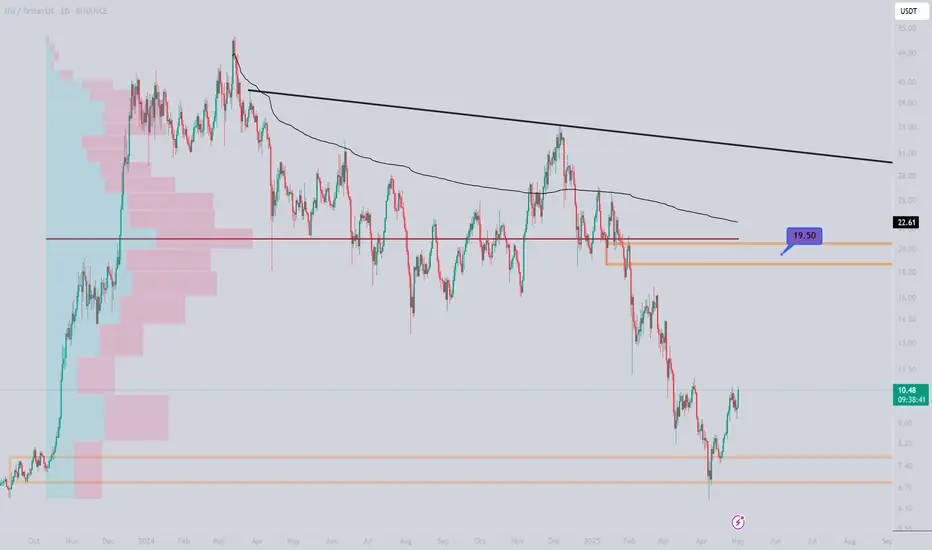
INJUSDTConsidering the monthly candle close
and the important breakeven and montomai range that it has taken
I expect growth to reach the 19 range in the first price step
InJ short to $9.42 areaJust opened a scalp short on INJ. Targeting $9.42.
Stop around $10.13 or higher
Time sensitive

INJUSDT 1D AnalysisINJ ~ 1D Analysis
#INJ Buy after successfully penetrating this resistant line with a short -term target of at least 10%+.

INJ Is Nearing An Important SupportHey Traders, in today's trading session we are monitoring INJ/USDT for a buying opportunity around 9.90 zone, INJ/USDT is trading in an uptrend and currently is in a correction phase in which it is approaching the trend at 9.90 support and resistance area.
Trade safe, Joe.

#INJ/USDT#INJ
The price is moving within a descending channel on the 1-hour frame, adhering well to it, and is heading for a strong breakout and retest.
We are experiencing a rebound from the lower boundary of the descending channel, which is support at 7.50.
We are experiencing a downtrend on the RSI indicator that is about to break and retest, supporting the upward trend.
We are looking for stability above the 100 Moving Average.
Entry price: 7.71
First target: 7.92
Second target: 8.42
Third target: 8.90

#INJ/USDT#INJ
The price is moving within a descending channel on the 1-hour frame, adhering well to it, and is heading for a strong breakout and retest.
We are seeing a bounce from the lower boundary of the descending channel, which is support at 8.25.
We have a downtrend on the RSI indicator that is about to be broken and retested, which supports the upward trend.
We are looking for stability above the 100 Moving Average.
Entry price: 8.58
First target: 8.80
Second target: 9.03
Third target: 9.31
