Technical Analysis of EUR/INR (4H Timeframe)In this EUR/INR analysis, we observe key confluences between price action and Fibonacci retracement levels, which are driving the pair's current movement. The pair is testing a critical support zone near 0.010727. A potential reversal could occur, as buyers seem to be stepping in at this level, which also coincides with the 23.6% Fibonacci retracement level at 0.010748 from the recent downtrend starting in August.
Key Observations:
Descending Channel Breakout: The pair appears to be breaking out from a descending channel, suggesting bullish momentum may be gaining strength. The breakout needs confirmation via a sustained close above 0.010803 (38.2% Fibonacci level).
Volume Profile Analysis
: Significant volume is concentrated around the 0.010803 to 0.010858 range, indicating potential resistance. A successful breach of the 0.010803 level will open the doors for a move toward the 50% Fibonacci retracement at 0.010858, followed by the 61.8% level at 0.010907, which aligns with another key supply zone.
Possible Scenarios:
Bullish Case
: If the price sustains above the 0.010803 resistance, it is likely to continue its upward movement toward 0.010907, with potential for further upside in the short term.
Bearish Case:
Failure to hold above the 0.010748 level could see the pair retesting the previous lows around 0.010650, marking a continuation of the downtrend.
Conclusion:
Traders should closely watch for confirmation of the breakout, particularly in the 0.010803 zone. A breakout will likely attract more bullish sentiment. The interplay of Fibonacci levels and volume clusters offers a roadmap for short-term trading decisions.
INREUR trade ideas

$INREURtime to swap your euros to INR
last capitulation wick
chop there for a bit
reclaim previous range low
resume uptrend after 2007
unless the Indian goverment wants to keep it low tbc

Today EURINR as per chart.hello,
As per chart of EURINR, support & resistance mark on chart, wait for breakout.
As per my analysis & as per tool show downtrend. below target are mark

Today EURINR Market level mark.Hello,
As per chart of EURINR, downside support 90.1042 / 89.9236 & Resistance mark 90.5715 /90.7279, Black line mark as Pivot line.90.3285.
as per my Analysis, first half downside for support level but overall market bullish

Today EURINR level mark on charthello,
/11
Today EURINR level mark, as per chart downside support is
90.2205 /90.2184/90.1155/89.8515/89.7490 & upside resistance 90.4882 /90.5779
wait for break out.

Today EURINR level as per charthello,
Today EURINR upside resistance 90.3273 / 3285 /3650 /4202 & downside support is 90.2380/ 2118.

EURINR LongHi All,
EURINR now made big support on chart, we can long from here small quantity target mentioned by arrow.
Thanks,

Redlight Greenlight that finds out two candles (red and green) and marks the high and low when the third candle breaks high immediately buy and when the third candle breaks the low then immediately sell

#EURINR#EURINR perfectly obeying downtrend line. This no chance for reversal unless trend line broken decisively.

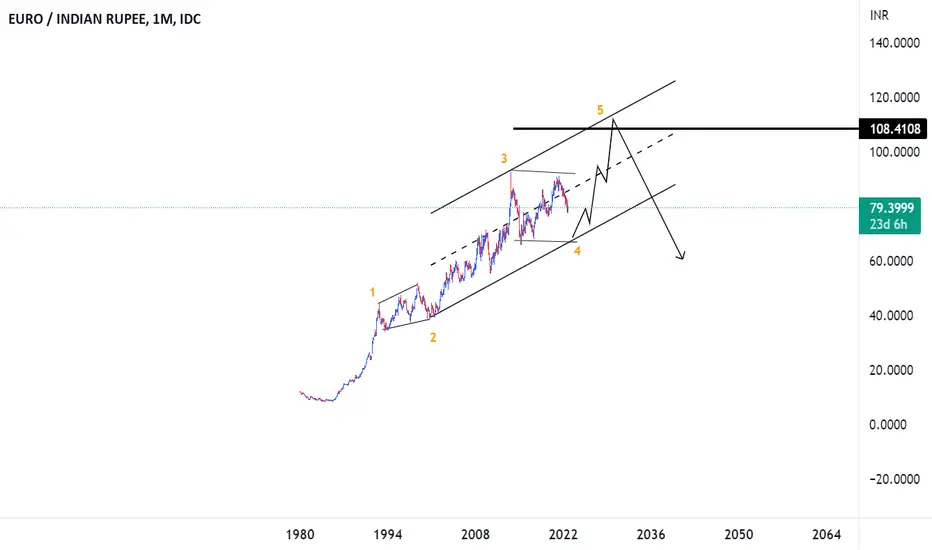
The EURINR pair Wave Analysis is in the Monthly impulse patternThe price pair is now trading in wave 4 Flat pattern....
#EURUSD it's possible to buy#EURUSD waiting for retracement and Price trading in nearby 4hr support area and waiting for bullish candlesticks formed it will take entry for above the bullish candlestick and it will go for the next level of resistance
Why we like it:
Price is trading in nearby 4hr support area
Waiting for bullish candlesticks formed
possible to move the next resistance area
waiting for retracement
1st support:
0.98504
Next Zone area & horizontal swing Low support
1st Resistance
1.08609
Zone area & horizontal swing high resistance

Short in EURINRThis pair is likely bounce back to its support line. I'm shorting at this level with set stoploss.

EURINR - THE BIG SHORT ?FX_IDC:EURINR Is on a constant downtrend from last year.
Based on the Moving Averages analysis on MTF, it looks like a good time to go SHORT.
TGT - 82.12,
2nd TGT - 80.3
STOPLOSS ABOVE 83.67

So it's very likely move upIt's has been confirmed on EURUSD, that pair will more upward for few trading sessions. We could expect the same with this pair as USDINR will remain rangebound. Follow for staying up-to-date.

Update 17-EUR/INRChart 1 - I would not prefer to enter short if the price breaks below 82.0803 because the present move lacks momentum to downside. It seems to be a corrective move to the previous upward move.
I would wait and watch the market for clues on building momentum to the downside.
What to expect?
Chart 2 - Possible moves are depicted as follows to wait and watch
There should be a conclusion in trend by 21 or 22 April 2022.
To catch the entry earlier, track the wave C for a 5 wave motive move to the upside. Spot wave 5 and enter short upon the price break below wave 4 of wave C.
Keep watching this space for further updates on trading and managing the trade.
To understand the concepts behind my analysis please checkout the linked idea. Happy trading :)
Disclaimer: Validate with your analysis before trading. This post is not a trading advise but a product of personal research and analysis

Running triangle and Leading DiagonalsTriangles are corrective patterns and diagonals are motive patterns.
Upon completing a triangular pattern the trend resumes.
Ending diagonal marks the end of a major wave or a trend and signals upcoming trend reversal or major correction.
Leading diagonal marks the start of a major wave or a trend after a major correction or reversal to previous trend. After a leading diagonal, a short correction can be expected before the trend resumes in the direction of leading diagonal.
In the previous post, the comparison is between running triangle and ending diagonals.
This post compares running triangle and leading diagonals.
Chart1: Running triangle and leaning diagonal in uptrend
As mentioned the comparison is in an uptrend. Accordingly upward move is termed as directional move and move to the downside is termed as non-directional.
A running triangle has non-directional momentum ie faster moves to the downside (wave A, C and E) than the upward moves (Waves B and D). These non-directional moves donot retrace the previous move completely.
On the contrary, Leading diagonal has directional momentum ie faster moves to the upside (waves 1, 3 and 5) in the direction of trend and these upward moves completely retrace the previous non-directional corrective moves (wave 2 and 4).
Chart2: Running triangle and leading diagonal in downtrend
As mentioned the comparison is in a downtrend. Accordingly downward move is termed as directional move and move to the upside is termed as non-directional.
A running triangle has non-directional momentum ie faster moves to the upside (wave A, C and E) than the downward moves (Waves B and D). These non-directional moves donot retrace the previous move completely.
On the contrary, Leading diagonal has directional momentum ie faster moves to the downside (waves 1, 3 and 5) in the direction of trend and these downward moves completely retrace the previous non-directional corrective moves (wave 2 and 4).

Update 14-EUR/INRYo! it's a long time since the last update. So what has happened mean while.
Chart 1: Price action resolved into a flat and had continued lower
So what's next.
Chart 2: Expect price to hit 81.4856 before on or before 22 April 2022
Chart 3: Price is under consolidation in 1H chart. Expect the consolidation to end during 14 April 2022 to 15 April 2022 when the price approaches the resistance zone 83.05-83.15
Trade setup:
Position : Short
Trading timeframe: 1H chart
Entry : 83.05-83.15 (based on validation with a bearish candle)
Stop loss : 83.77
Target 1 : 81.4856
Target 2 : 80.3217 ( if price breaks below 81.1737 with high momentum before 19 April 2022)
Target date : 22 April 2022 +/- 1 day
Keep watching this space for further updates on trading and managing the trade.
To understand the concepts behind my analysis please checkout the linked idea. Happy trading :)
Disclaimer: Validate with your analysis before trading. This post is not a trading advise but a product of personal research and analysis

EUR/INR Price AnalysisDue to Geopolitical tensions, the value of the Euro is expected to rise in comparison to INR. The currency pair has broken out and is looking to retest before continuing with the up move. So It would be a good idea to enter in a retest and expect a reversal rally. 200 EMA also acts as a firm dynamic support. Supports are marked in Green and Resistances in Red. In case of breakdown, we can expect the pair to dip towards the 77 mark. Forex Trading Positions betting on currency value depreciation can also act as a Hedge for Long Positions in Indian Equity Swing Trading.
So it would be a good idea to go long on Retest and wait for the pair to break out of the smaller triangle pattern.
Long @ 82.55
Stop Loss @ 80.05
Target @ 87.55
Risk Reward Ratio 2:1
Selling Put Options near the Support Options with Hedge could also be a good strategy.
Note: Views are personal, Not Responsible for P & L. DYOR before trading/Investing.

rupie strenth???possible breakthrough strategy
80 is a zone where in the past this exchange has been confortable

Update 13-EUR/INRYo!! the price broke below 85.2494 but late beyond 15/02/2022 forming a diagonal wave A or 1. The break was followed by a consolidation forming a triangle wave B or 2. Triangle consolidation was followed by wave C or 3. Chart 1 shows the patterns.
Chart 1:
What to expect now? In wave C or 3, minor waves 1 and 2 are over, wave 3 is in progress and might be over if it breaks above 84.6010. Expect wave 4 to move up to 84.80 and wait until 21/02/2022 12:30 (Indian Standard Time) to identify the pattern to take the next move in wave 5.
For sure, I shall not be in a position to update it by 21/02/2022 12:30 (Indian Standard Time) on the pattern, but will try. But right now I have already positioned short at 85.2269 and waiting to hit the target 84.43.
If the price breaks below 84.4271 before 21/02/2022 20:30 (Indian Standard Time) then the momentum of the current move to the downside labelled as wave C or 3 shall be higher than wave A or 1. This momentum shall indicate further downside move after a consolidation. Lets wait and see.
Keep watching this space for further updates on trading and managing the trade.
To understand the concepts behind my analysis please checkout the linked idea. Happy trading :)

Update 12-EUR/INRChart 1:
What is going on with this pair after wave X in Chart 1? I really have no clue but could guess the following patterns.
Option 1: - Chart 2
If the price does not break above 86.5568 on or before 1/03/2022, then this could be a triangle which forms Major Wave Y.
If the price breaks above 86.5568 on or before 01/03/2022 the this could be a flat correction to wave A as shown in Chart 3. Flat correction shall be targeting 86.5568 to 87.00
Chart 3:
1H chart analysis:
Chart 4: Price had reversed the downward momentum in lower time frame and had progressed upwards in a 5 wave move.
Chart 5: If the price move below 85.2494 before 15/02/2022 1:30 (IST) then expect a correction to the 5 wave upward move. This correction could target 84.8707.
Trade setup: At present there is no trade setup until the price had broken above 86.5568 before 01/03/2022 or below 85.2494 before 15/02/2022.
Wait and watch.
Keep watching this space for further updates on trading and managing the trade.
To understand the concepts behind my analysis please checkout the linked idea. Happy trading :)


EURINRJust below trendline
If it comes back to support area then it will be a good buy
This is just my view and not recommendation
