EUR INR_ BEARISHHi,
If one looks at weekly chart, trend is bearish..
Now after looking at 4H TF, trend again looks bearish, price action signal at support is required for further price movement
Thanks for reading!
INREUR trade ideas


EURINR Head and Shoulder Patternwe can not jump directly into signal here.
you should wait for market to completely close below the head and shoulder which is overall confirmation sign.
it can go above from here and than dump if this is eur overall looks weak so analyzing for now will enter next week

EURINR looking for shortLooking for shorting this pair for long run, for every rise, finding new entry for sell unless a clear break of 86.740 happens, might change the direction,
:Risk Management is the ultimate skill to survive in trading, so, please maintain it wile trading

!!Going to be a Huge move!! EURINR correction spotted 16.06.2020This post is in continuation to multi time frame analysis linked to this idea.
Correction to uptrend is spotted as shown in chart.
Trade setup:
Trade direction: Long
Entry: Upon 1D close above the correction pattern
Stop loss: 84.9
Target: 92.0
Target Duration: July -August 2020
I don't want likes, I want agreements / disagreements.
Please post your agreements with thumbs up.
Post your disagreement in comments.
Please don't follow me I am not giving calls, I am looking for like minded people to discuss and trade with

EURINR,D1 TIMEFRAMEAFTER 2 YEARS OF EXPERIENCE IN FOREX AND INDIAN MARKET I NEVER SEEN A CLEAR DIVERGENCE LIKE EURINR HENCE MY OPINION IT TO SHORT ON THIS PAIR

Hourly time frame analysis in continuation to 13.06.2020Please find the hourly time frame analysis which was missed in previous posting. Previous posting on Multi Time frame analysis posted on 13.06.2020 is linked here with.
Its again a wait and watch situation for short/long/swing trading.


EURINR Analysis 20.05.2020FX_IDC:EURINR
In my analysis posted on 12.05.2020, this correction channel was overlooked.
At present the price action is deviating the correction to uptrend.
1D close above the channel shall be bullish signal.
Targets are mentioned on chart.
Please comment with your views, agreement / disagreement.

EURINR Analysis 12.05.2020FX_IDC:EURINR
Triangle pattern is broken to the downside.
Time to short.
Stay short as long as the price is within the resistance of channel.
Hope it shall be fun following the trend

Up Next..EURINR is in an interesting pattern formation. If the current move after the flag is a flat, then the next move is an UP. I would need a flag or a lower degree flat to go long for a target to retest the recent top beyond the B of the flat. Its a simple "If-then-else" thought flow.
**This is not a trade advice**

EURINR Analysis 10.04.2020FX_IDC:EURINR
1M chart below shows that the price action is contained within the disjoint channel and major support and resistance areas
1W chart below indicates that recently the price was rejected when it tested the resistance at 84.3 and is under consolidation. Any close above the this resistance in 1W timeframe shall be bullish signal.
1D chart below implies that the price action is forming a triangle pattern.
Daily close above the triangle pattern shall test 84 to 84.3
Daily close below the triganle pattern shall target 80.7
Comments and debats are welcomed

EURINR Analysis 08.01.2020Daily chart interpretation
FX_IDC:EURINR
1. Price action is predicted to be inside red downtrend channel. Yet the resistance line of channel is to be validated.
2. Resistance line of red channel shall be validated only upon price action breaking below the blue support line in correction.
Trade setup:
Time frame: Daily chart
Trade: Sell
Entry: Upon price action breaking the blue support line in correction and closing below it.
Stop loss: Recent high
Target: 77.0 and 75.0


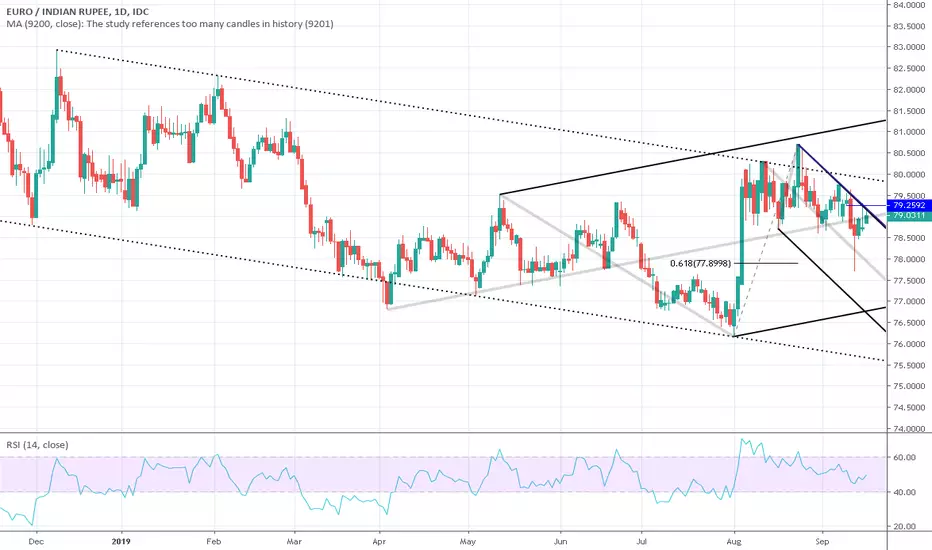
Is EURUSD/EURINR in support Zone?With Long Downtrend in the USDINR and the Forex Market EURINR has fallen down to its s upport zone of 76.50-77 range . One can buy with the target of 77.90-78 with the SL of 76.45
Considering that USDINR will be positive and EURUSD will be stable or vice-versa.

Buy SetupEURINR is probably in a complex corrective structure and looking at the pattern,there is a high probability of an Up move to happen somewhere from these levels taking the pair back to 80 levels. It could straight away breakout and move or make a lower low on the 1 hour before the move. The risk reward too seems to be in favor of Buys. Confirmation awaited.


Finding key support and resistance levels in currency pairs FX_IDC:EURINR
First of all, the most important thing to remember is the support and resistance levels are not exact numbers. Often times you will see that market broke the support/resistance level but in reality, it was just testing that level. To filter out these false breakouts you should think of support and resistance more of as "zones" instead of actual figures.
So how do you find these zones?
One way of doing it is to plot support and resistance on a line chart rather than a candlestick chart because the line chart plots only closing price. Sometimes candlesticks add extreme lows and highs to the picture which might be misleading because often times they are just "knee-jerk" reactions of the market because someone did something really strange for no reason.
Use a weekly or a daily timeframe to find better swing lows and highs for finding support and resistance and besides that, you get the view of a bigger picture in larger timeframes and you can always use smaller timeframes to look at the smaller picture.
After you plot the support and resistance zones turn your chart back to candlesticks and when price approaches the respective zones you can make use of price action and volumes to enter high probability trades.
With little practice, you will be able to spot potential support and resistance areas easily.

