INRUSD trade ideas
USDINR - A Triangle PossibilityUSDINR.
There is a possibility for a triangular formation on this pair based on the idea that all the waves have a 3 wave structure in the form of a-b-c. In such case, the price will be forming another bullish wave following a breakout. The analysis is based on the Elliott Wave Theory.
USDINR taking channel supportUSDINR saw a sharp decline today. With this fall, it has touched the support region of the rising channel within which it was moving for last few weeks.
As the RSI is also reaching the oversold region, I feel there might be a pause here and we may see some pullback.
I will wait for the price-action to unfold during next few hours on this support region to determine the direction of next move.
USDINR - Approaching resistance zoneAfter showing a sharp fall early last week, USDINR has again started its upward journey. It is slowly approaching a strong resistance zone. This zone lies between 79.69 - 79.82. A breakout of this will clear its path towards 80.00 and then towards the recent all time high of 80.20.
However, a strong rejection of this level might mean a fall back to 79.00 levels.
So, if you are planning a fresh entry, price action in the region of 79.69 - 79.82 is an area to watch for.
USDINR current price going to be a historyUSDINR is going to be a history at this current price where it is standing.
People (traders and investors) are going to remember this price 81 for a very long time.
I am an Elliottician and I will upload the counts of this chart. Right now, all I can say is that this chart is going to make a big reversal. The psychology of money is telling that something big is going to happen here.
The time of India is start now.
Short USDINR with the capital at which you can bear loses because the real meat if you want to eat, a right amout of capital should be placed on a trade.
Thanks
USDINR - Testing a critical resistanceUSDINR gave a strong upmove last day and is now out of the weekly resistance of trend-line. The resistance was broken with a strong candle and we can expect further upmove.
At the same time, USDINR is testing another resistance trend-line that has been tested 3 times since 2013 and now being tested for the 4th time. A weekly close above this would mean further uptrend.
However, we don't see a deep down-side also as of now since we broke a trendline nearby laready.
As of now, I am Neutral to Bullish on this pair with a strong support region of 78.40 - 78.30. Daily close below this would mean change in trend.
USD/INR shortTechnical indicators indicate corrections the need. I specially chose the purpose achievement by which perhaps with high probability. It does not mean that correction on it will end. On the week chart the price moves in the upward channel, that is the medium-term trend remains upward.
TP = 76.42
Information provided is only educational and should not be used to take action in the market.
USDINR- Broke the resistance zoneUSDINR has broken the falling trendline and also broke past an important horizontal resistance region of 78.15 - 78.20. This was broken with a huge candle.
With this move, it has not only broken the horizontal and trendline supports, but also the tend of LL-LH. This is a clear bullish signal. However, we can't go away with the fact that the central bank may step in to control these levels.
Let's see how the follow-through candles develop today and tomorrow on Daily timeframe. It shall retain the 78.15 - 78.20 region for further up-move.
USDINR - Short-term trend looks downUSDINR is forming lower-lows and lower-highs. Same is the case with RSI.
I see the upward side strong resistance zone remains between 78.05 - 78.10. Till the time 78.10 is not broken on the upside, I see we may see some bearish to sideways trend in USDINR during next few days.
USDINR looks strong on Daily & Weekly timeframe, heading to 77.8USDINR is rising on rising sharply due rising crude oil prices this week, as European nations has said No to Russian Oil.
USDINR is looking strong and can head to levels of 77.8 where it can face huge resistance.
If USDINR manages to trade above 77.8 levels on daily and weekly timeframes, then it is heading towards 78.5 levels.
If BEARS managed to hold USDINR further upward movement or if RBI intervenes, then it can fall back to retest 77.4 levels.
P.S. Most of this movement in USDINR this week would be dependent on how CRUDE OIL performs in global markets.
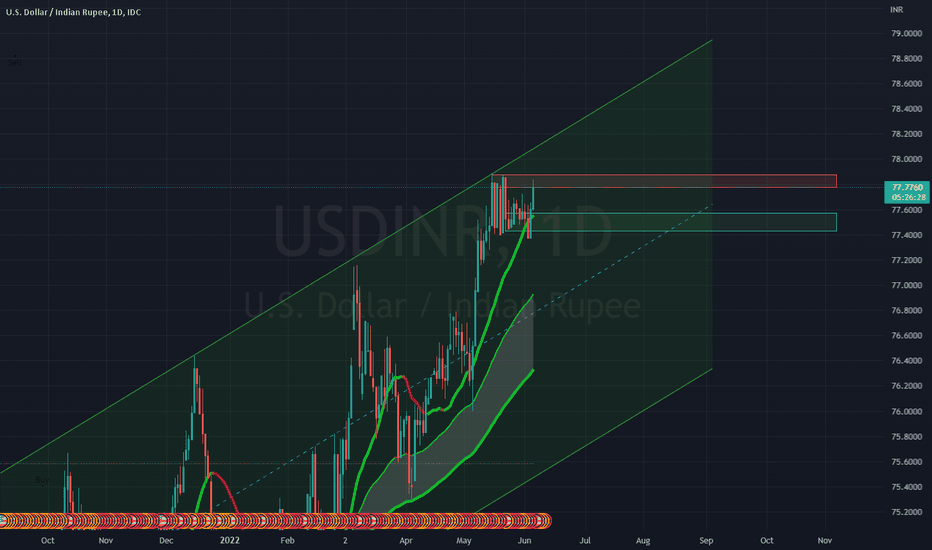
USDINR looks to be good short, heading down to 77.2 levelsUSDINR has been trading in an Upward Parallel Channel, since last year end till now. Recently it has hit the upper top of the channel at 77.88 levels.
Its a SELL till 77.4 and if it breaks 77.4 level with good volume, it can further drift down to 77.17 levels.
76.94 to 77.1 7 is a Buy Zone, where can be a bounce back but till that time, its a Short.


